

C57BL/6-Cd3etm2(CD3E)Bcgen/Bcgen • 110008

CD3: An Important Therapeutic Target in Immunotherapy

Targeting strategy of CD3E humanized mice.
In CD3E humanized mice, the exons 2–6 of the mouse Cd3e gene, which encode the extracellular domain, were replaced with human CD3E exons 2–7. This precise knock-in design enables strain-specific expression of human CD3E, supporting preclinical evaluation of CD3-targeted immunotherapies.

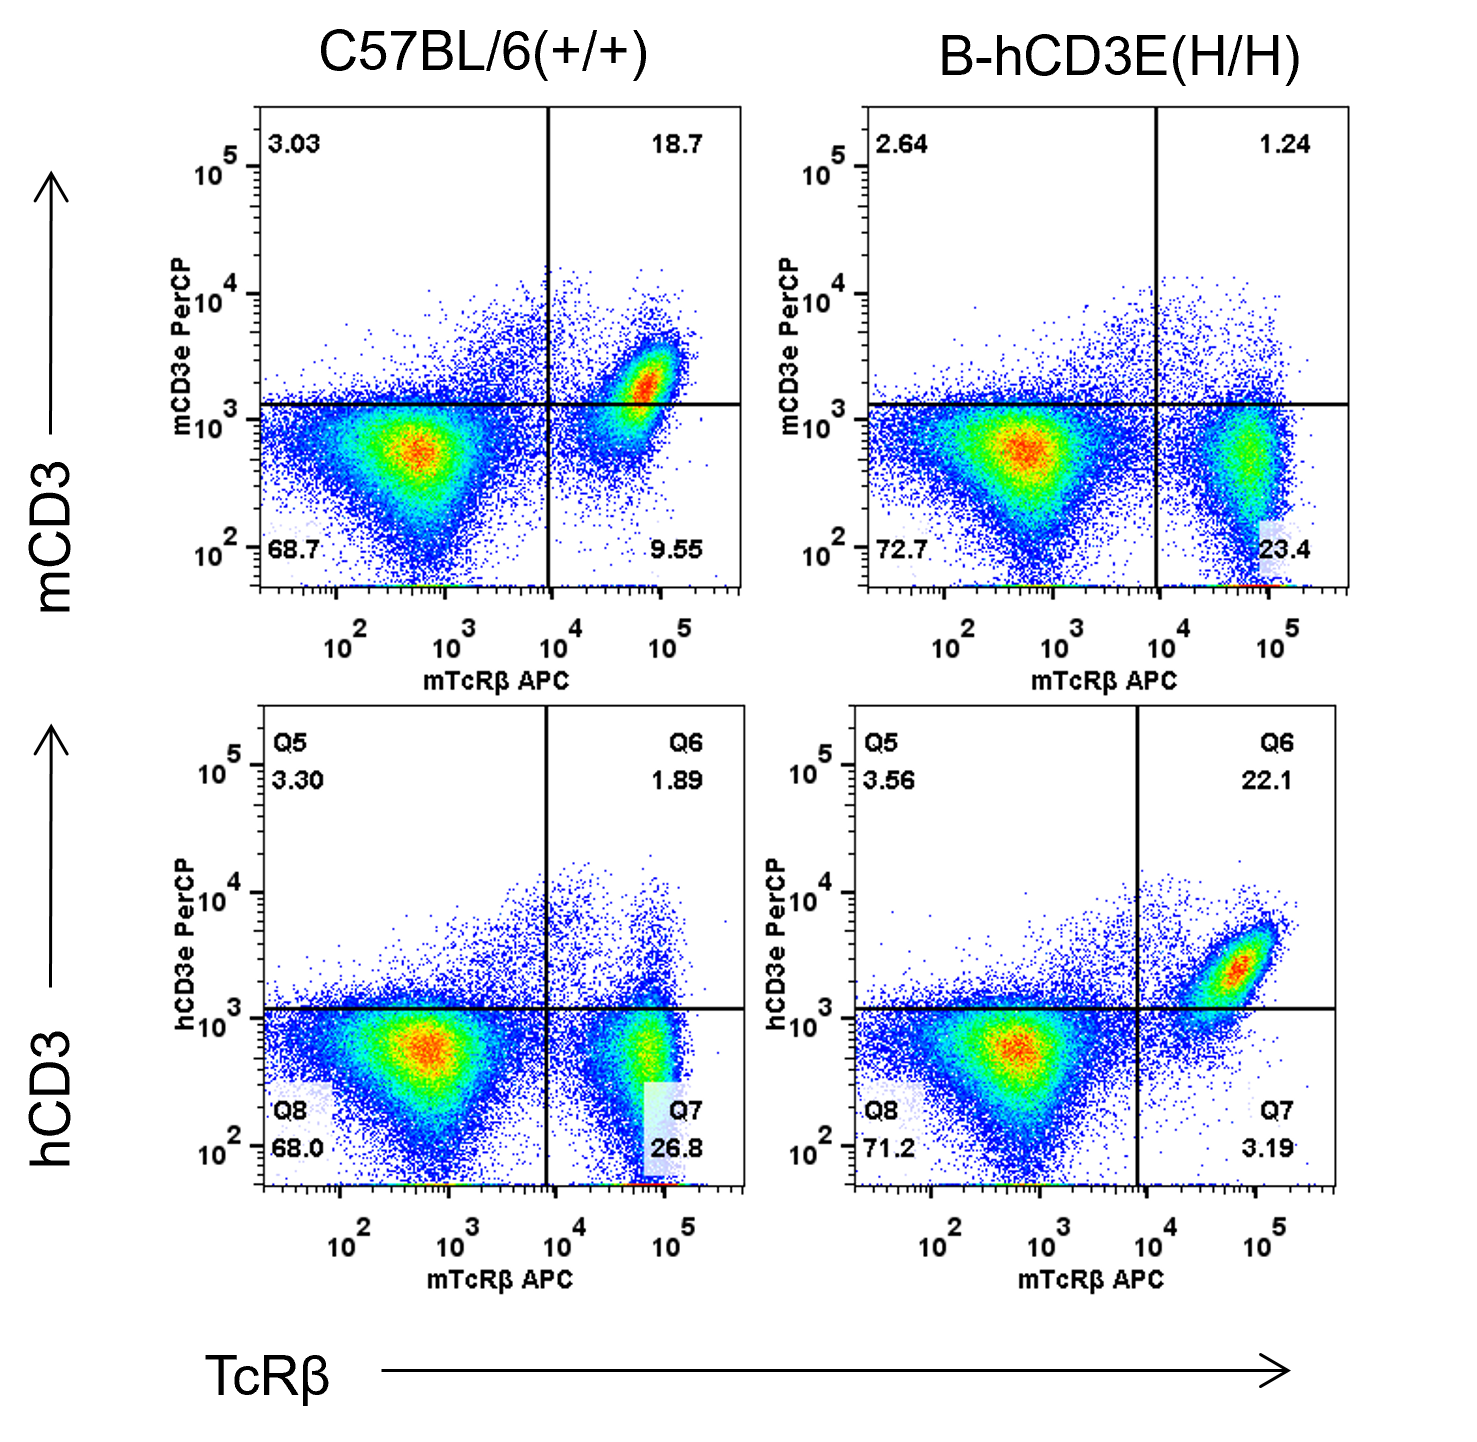
Mouse and human CD3E expression analysis in splenocytes. Splenocytes were collected from wild-type C57BL/6 mice (+/+) and homozygous B-hCD3E mice (H/H), and analyzed by flow cytometry with species-specific anti-mouse CD3ε antibody (Biolegend, 100326, clone 145-2C11) and anti-human CD3ε antibody (Biolegend 300428, clone UCHT1).
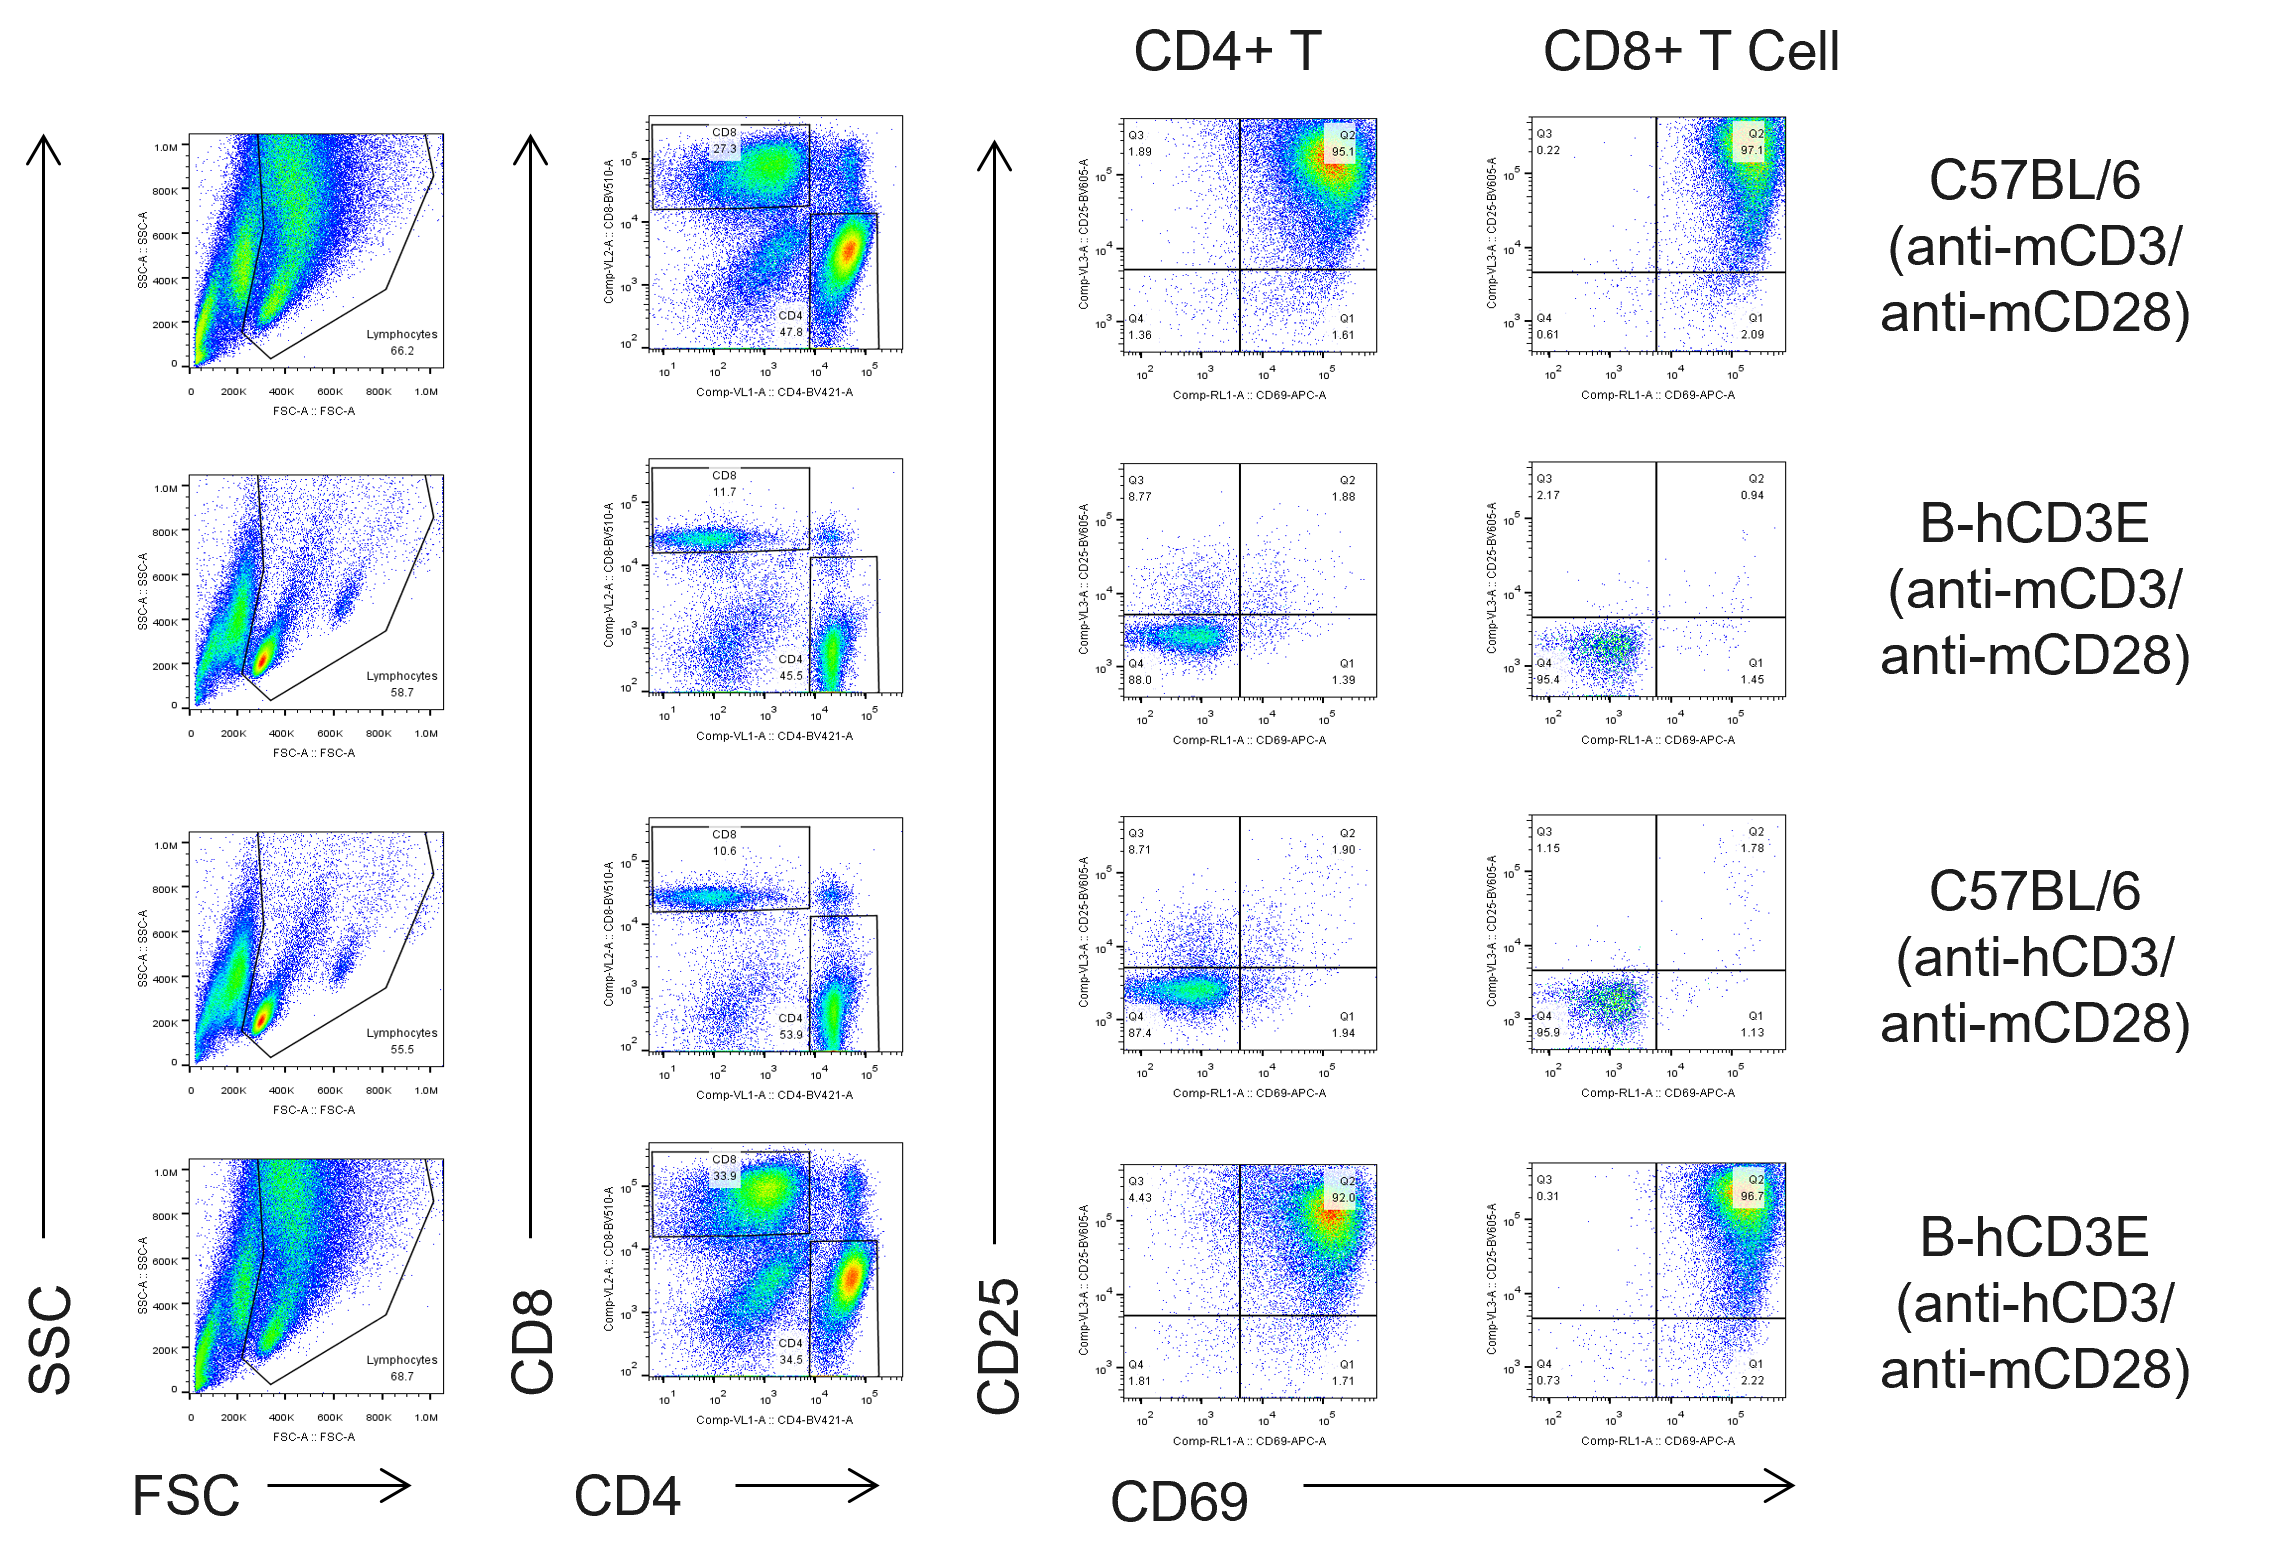
In vitro T cells activation. T cells (2.5×10⁶) were isolated from splenocytes of C57BL/6 and B-hCD3E mice (n=4), and were incubated in the presence of anti-mouse CD3ε antibody (BioXCell, BE0001-1, clone 145-2C11, 2μg/ml), anti-human CD3ε antibody (BioXCell, BE0001-2, clone OKT3, 2μg/ml) and anti-mCD28 antibody (BioXCell, BE0015-1, clone 37.51, 5μg/ml) for 48h. T cell activation was tested by flow cytometry.
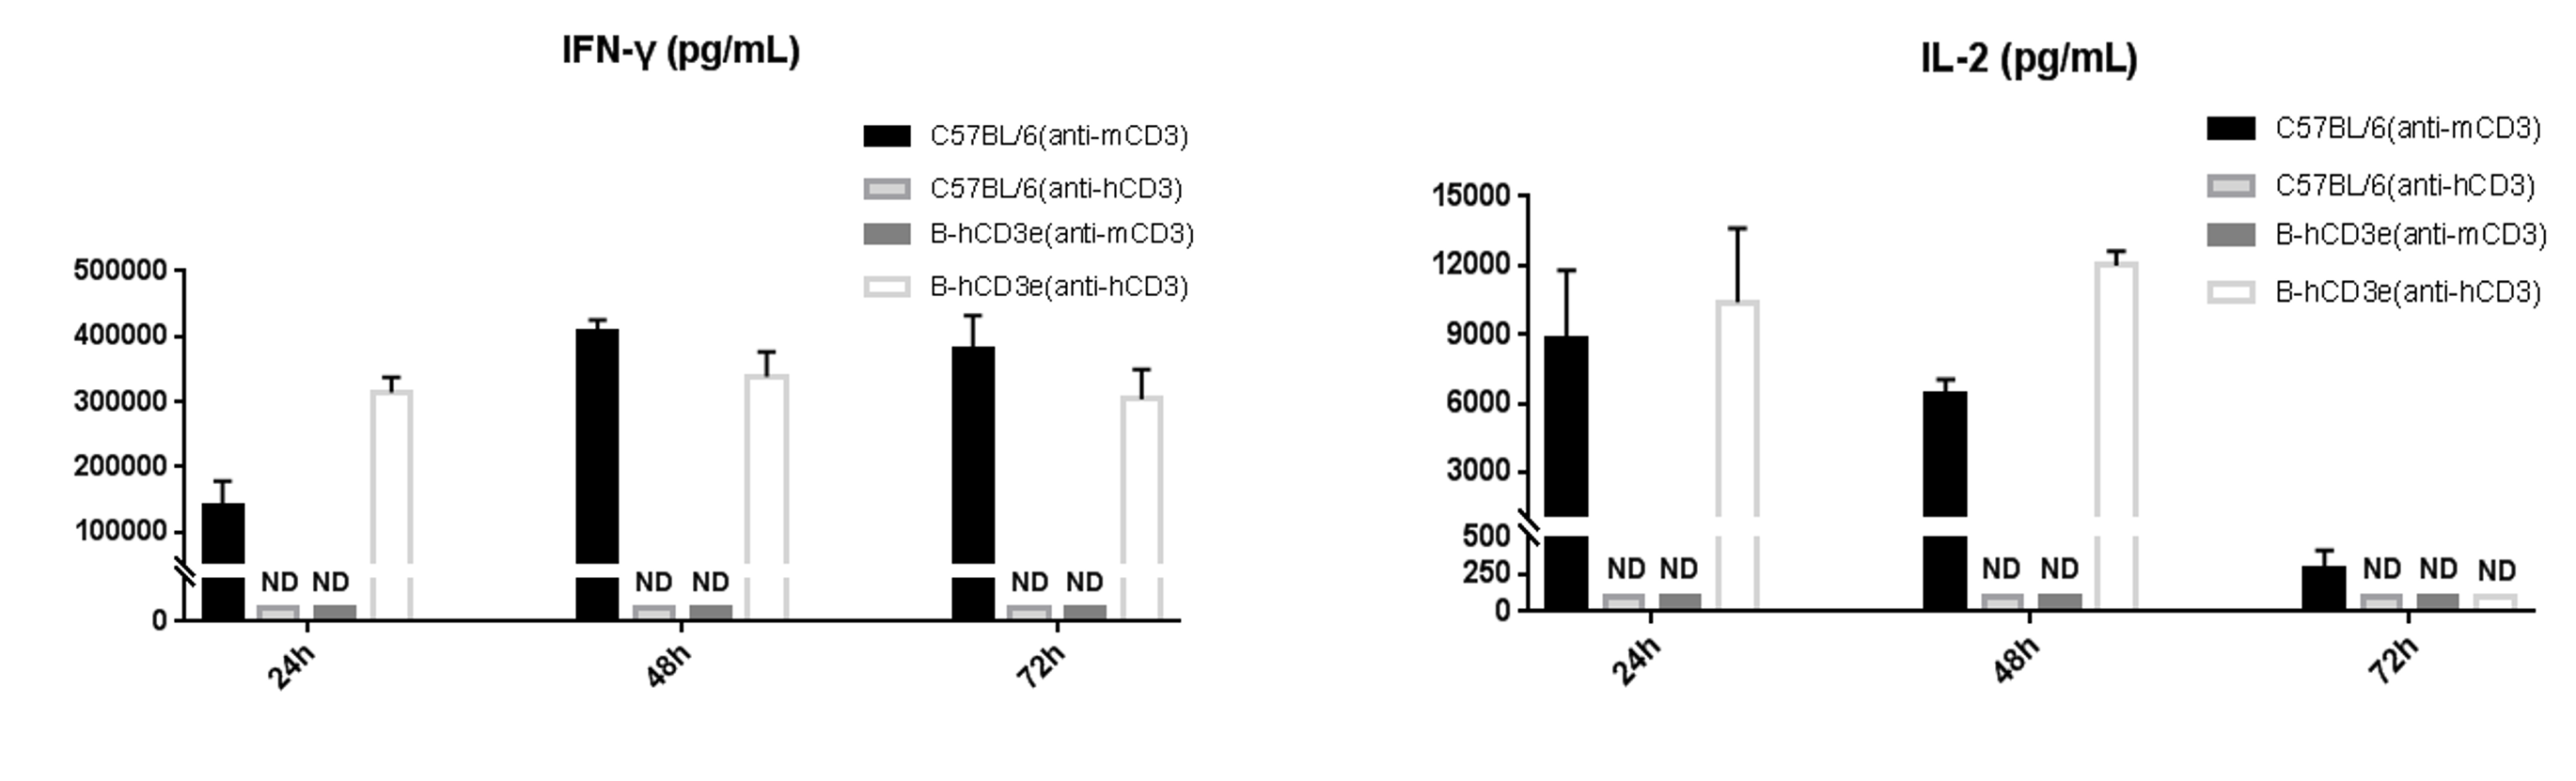
In vitro T cells activation. T cells (2.5×10⁶) were isolated from the splenocytes of C57BL/6 and B-hCD3E mice (n=4), incubated in the presence of anti-mouse CD3ε antibody (BioXCell, BE0001-1, clone 145-2C11, 2ug/ml), anti-human CD3ε antibody (BioXCell, BE0001-2, clone OKT3, 2ug/ml) and anti-mCD28 antibody (BioXCell, BE0015-1, clone 37.51, 5ug/ml) for 24h, 48h and 72h. IFN-γ and IL-2 productions were then tested using ELISA method. Values are expressed as mean ± SEM. ND: not detectable.
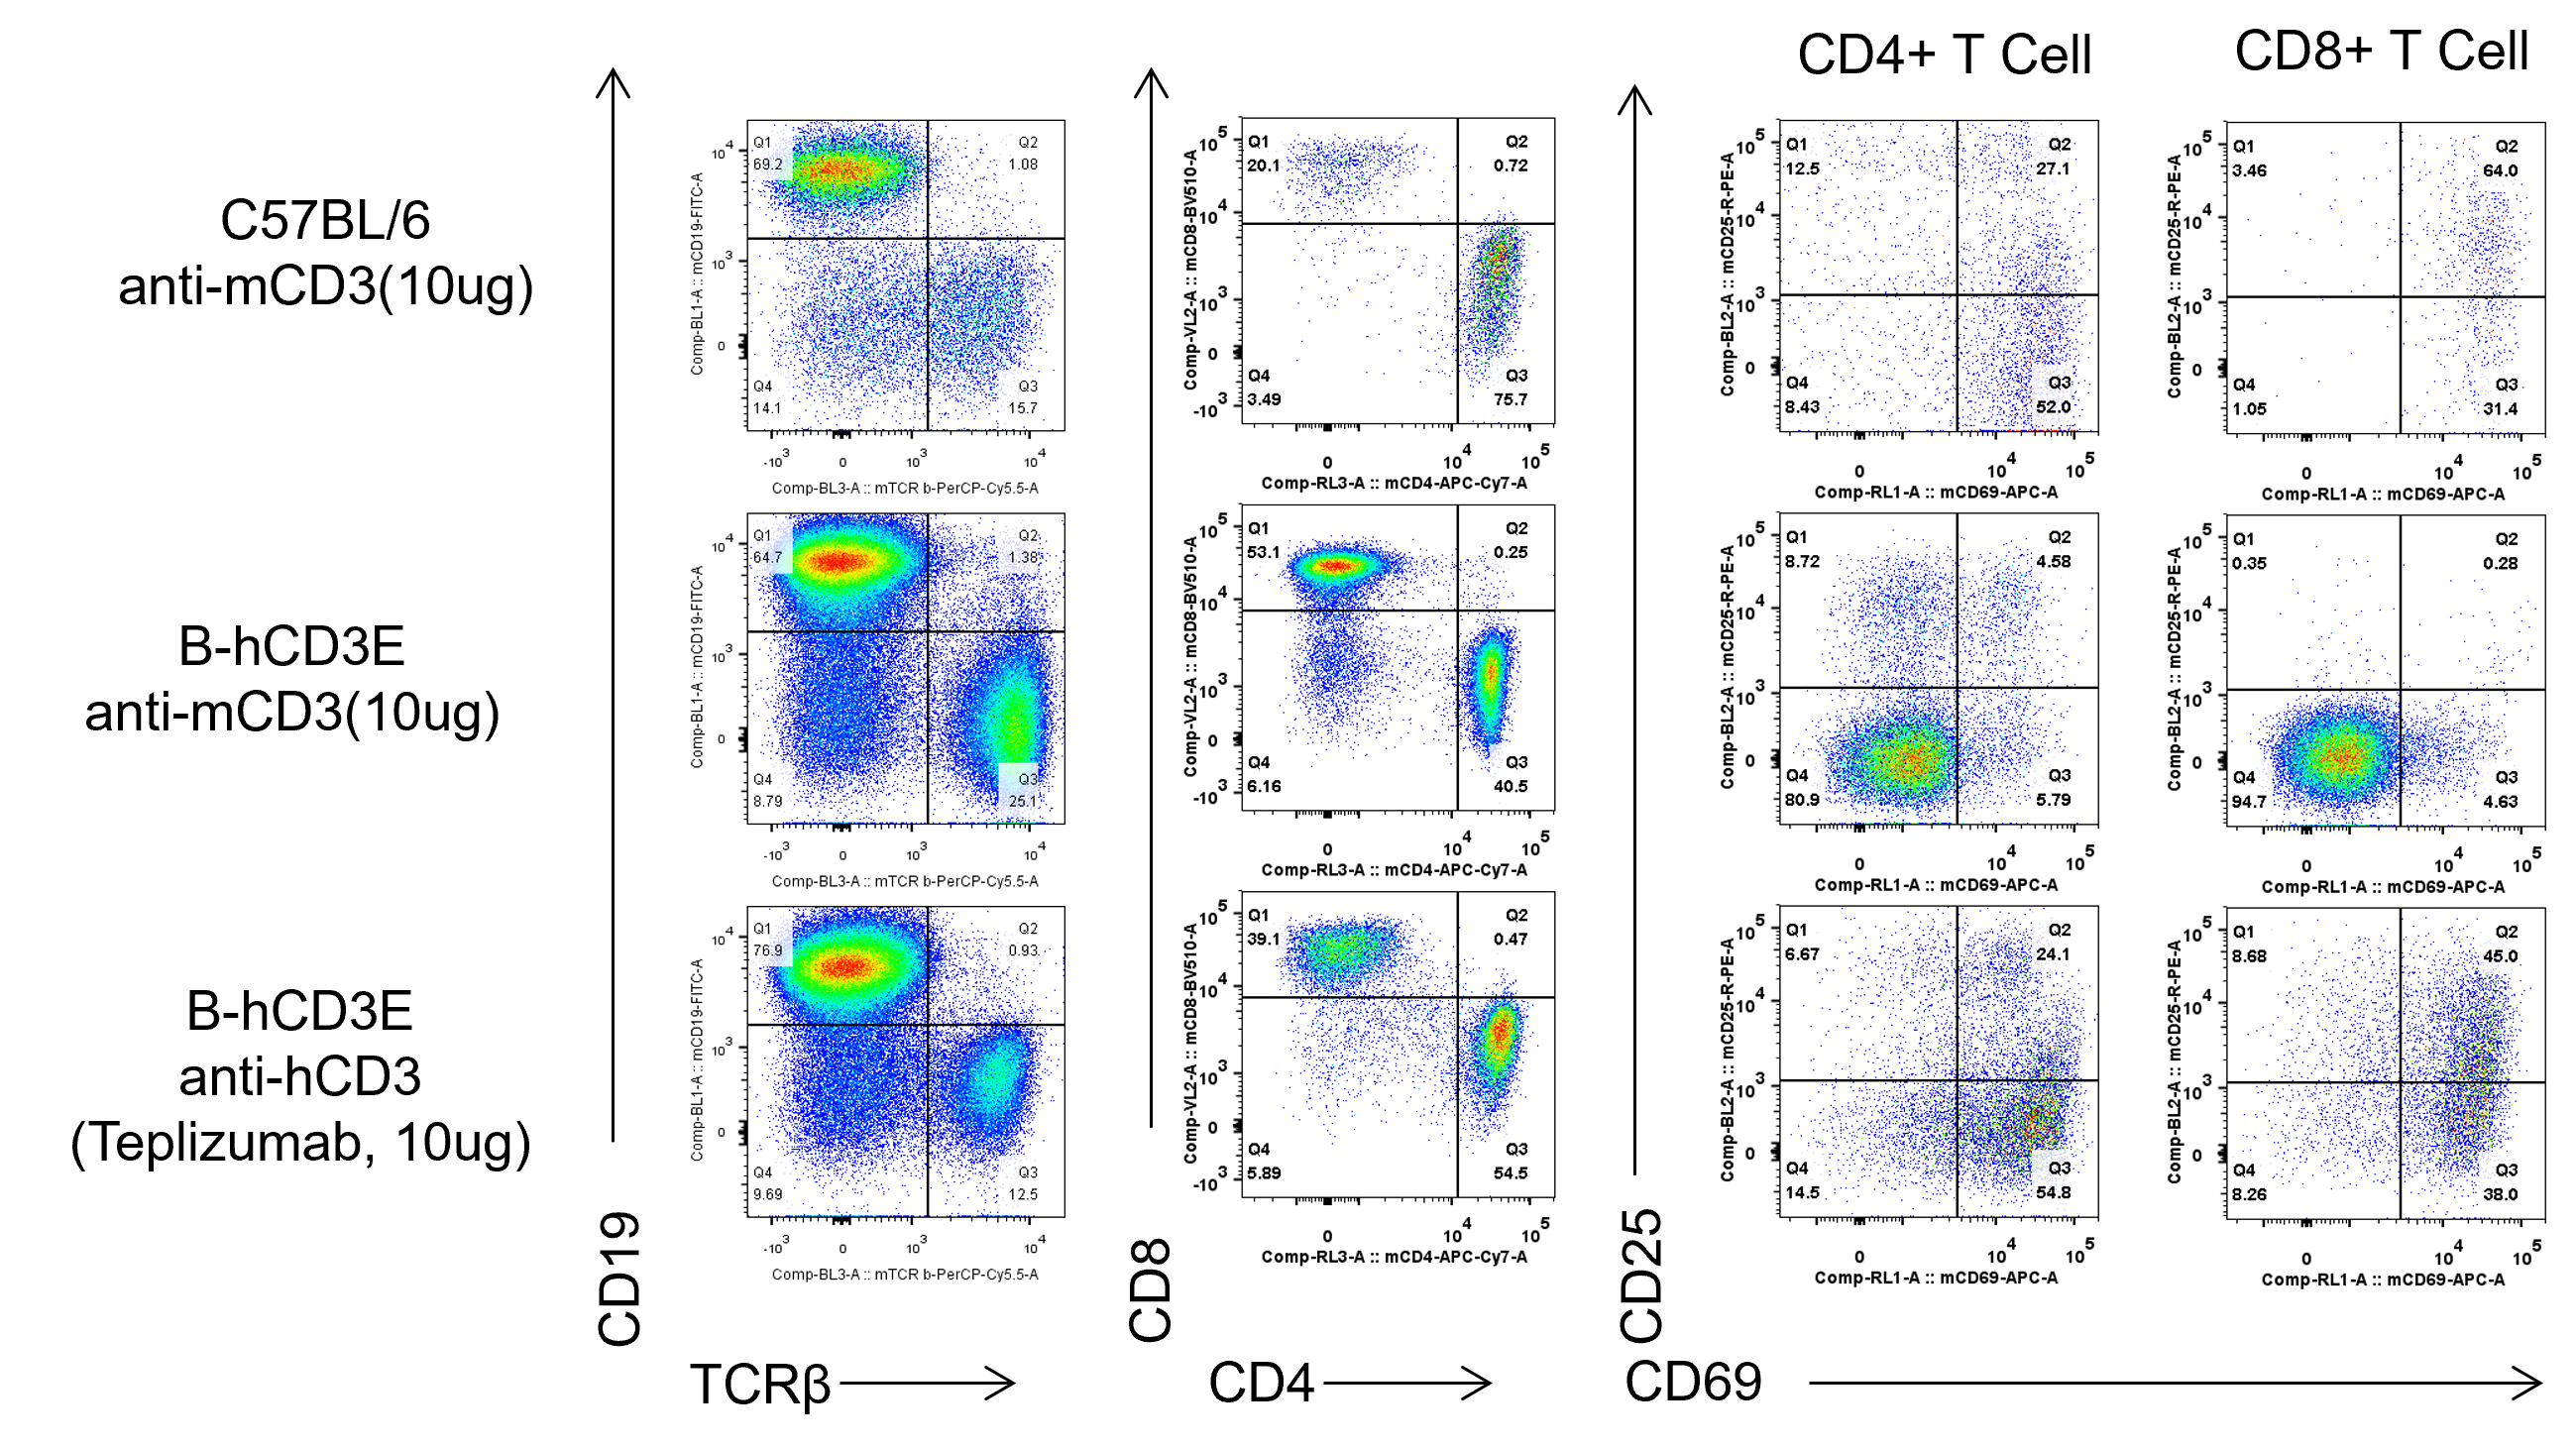
In vivo T cells activation. C57BL/6 and B-hCD3E mice were injected intraperitoneally with anti-CD3E antibody (10ug/mouse). After 24h, T cells were isolated from splenocytes of C57BL/6 and B-hCD3E mice (n=4). T cell proliferation was measured by flow cytometry.
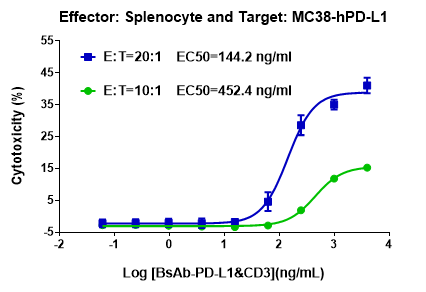
In vitro cytotoxicity evaluation of an anti-CD3/PD-L1 bispecific antibody against human PD-L1–expressing MC38 Cells. B-hCD3E mouse spleen cells were mixed with MC38-hPD-L1 and various concentrations of CD3-PD-L1 bispecific antibodies provided by the client were added. The killing activity was detected after 48 hours. When effector cells : target cells (E:T) =10:1, the EC50 of CD3-PD-L1 bispecific antibodies activity was 452.4 ng/mL; When E:T=20:1, the EC50 of CD3-PD-L1 bispecific antibodies activity was 144.2 ng/mL.
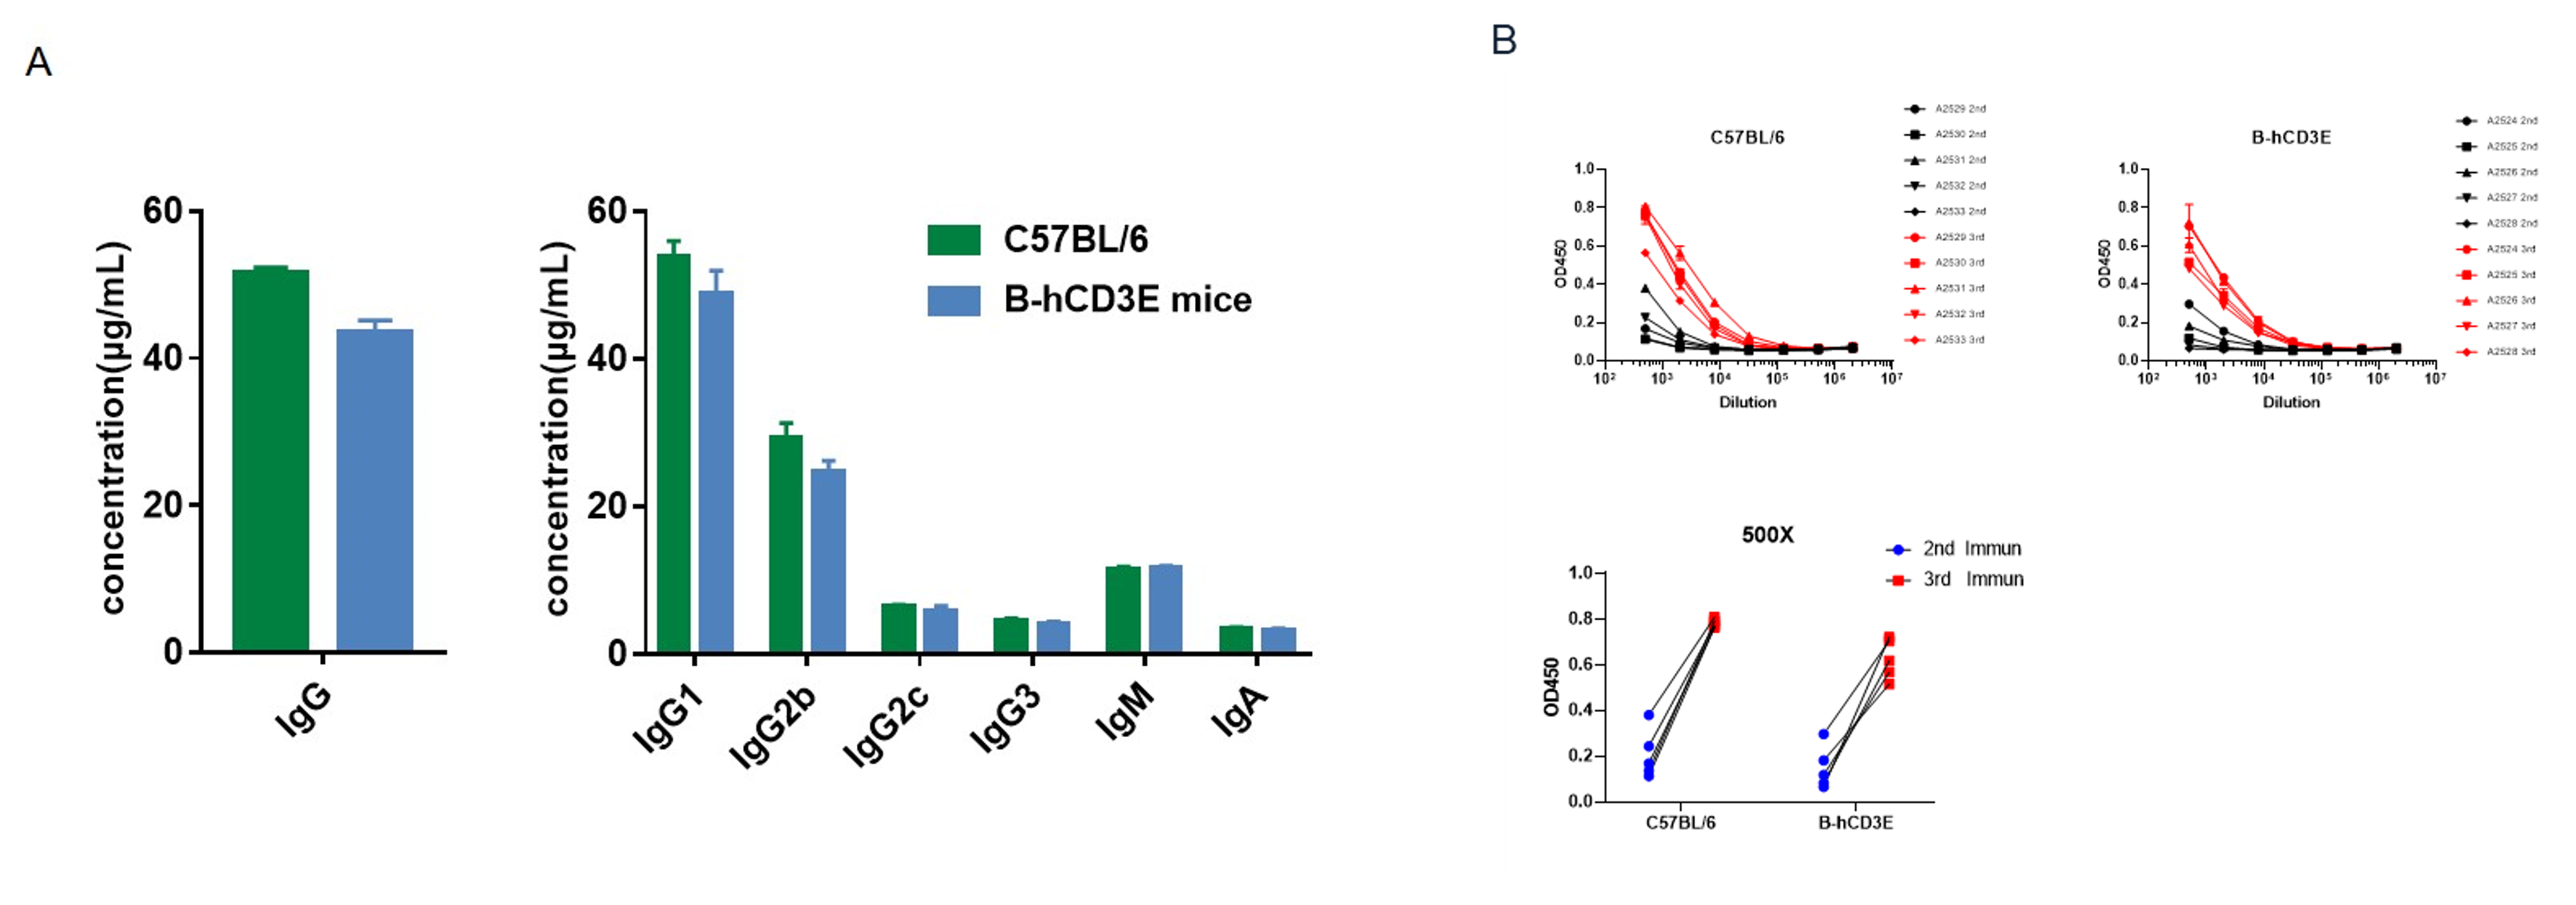
Serum Titers of OVA-Specific Antibodies. B-hCD3E mice (n=5, 6-week-old) were immunized three times with OVA, 2 weeks apart. Blood samples were collected a week after immunization. (A) Quantification of serum IgG subtypes of mice before immunization. (B) Serum titer test of mice after the second and third immunizations. Values are expressed as mean ± SEM.
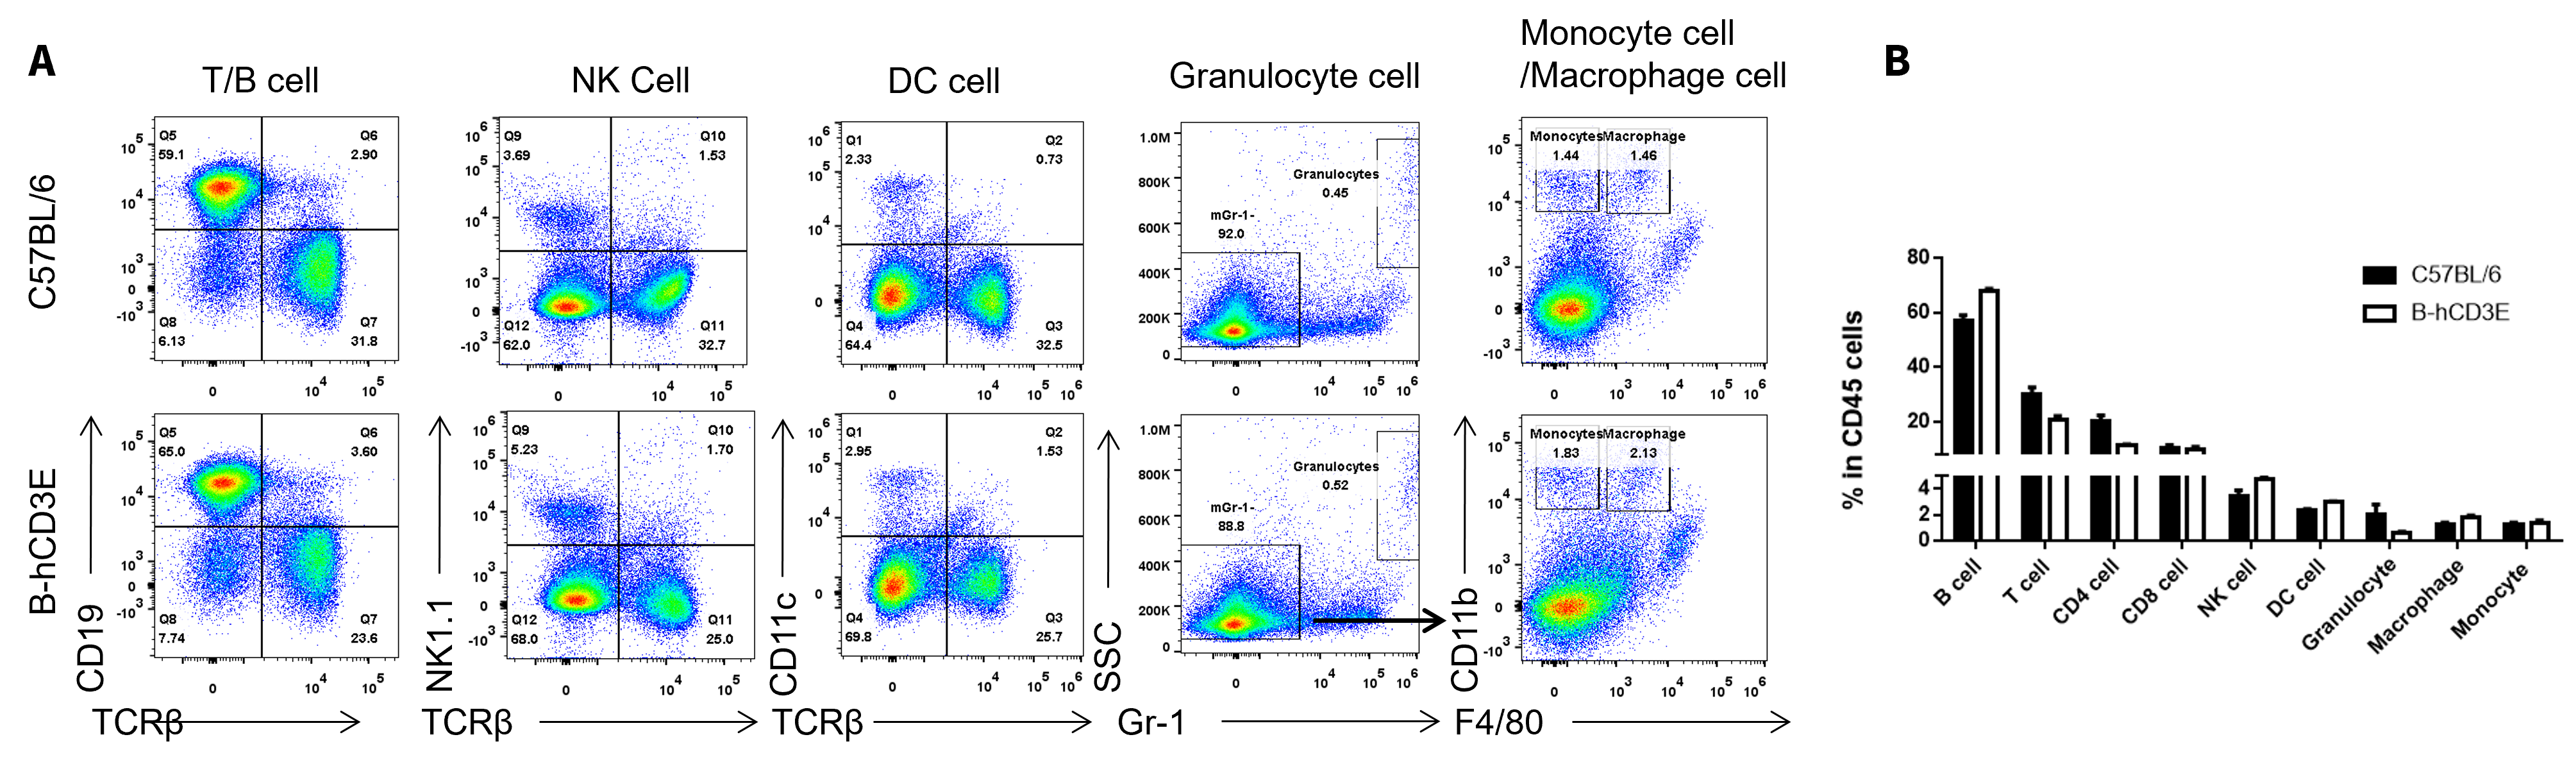
Analysis of leukocyte subpopulations by flow cytometry in immune organs. Splenocytes were isolated from female C57BL/6 and B-hCD3E mice (n=3, 6-week-old). Flow cytometry analysis of the splenocytes was performed to assess leukocyte subpopulations. A. Representative FACS plots. Single live cells were gated for CD45+ population and used for further analysis as indicated here. B. Results of FACS analysis.
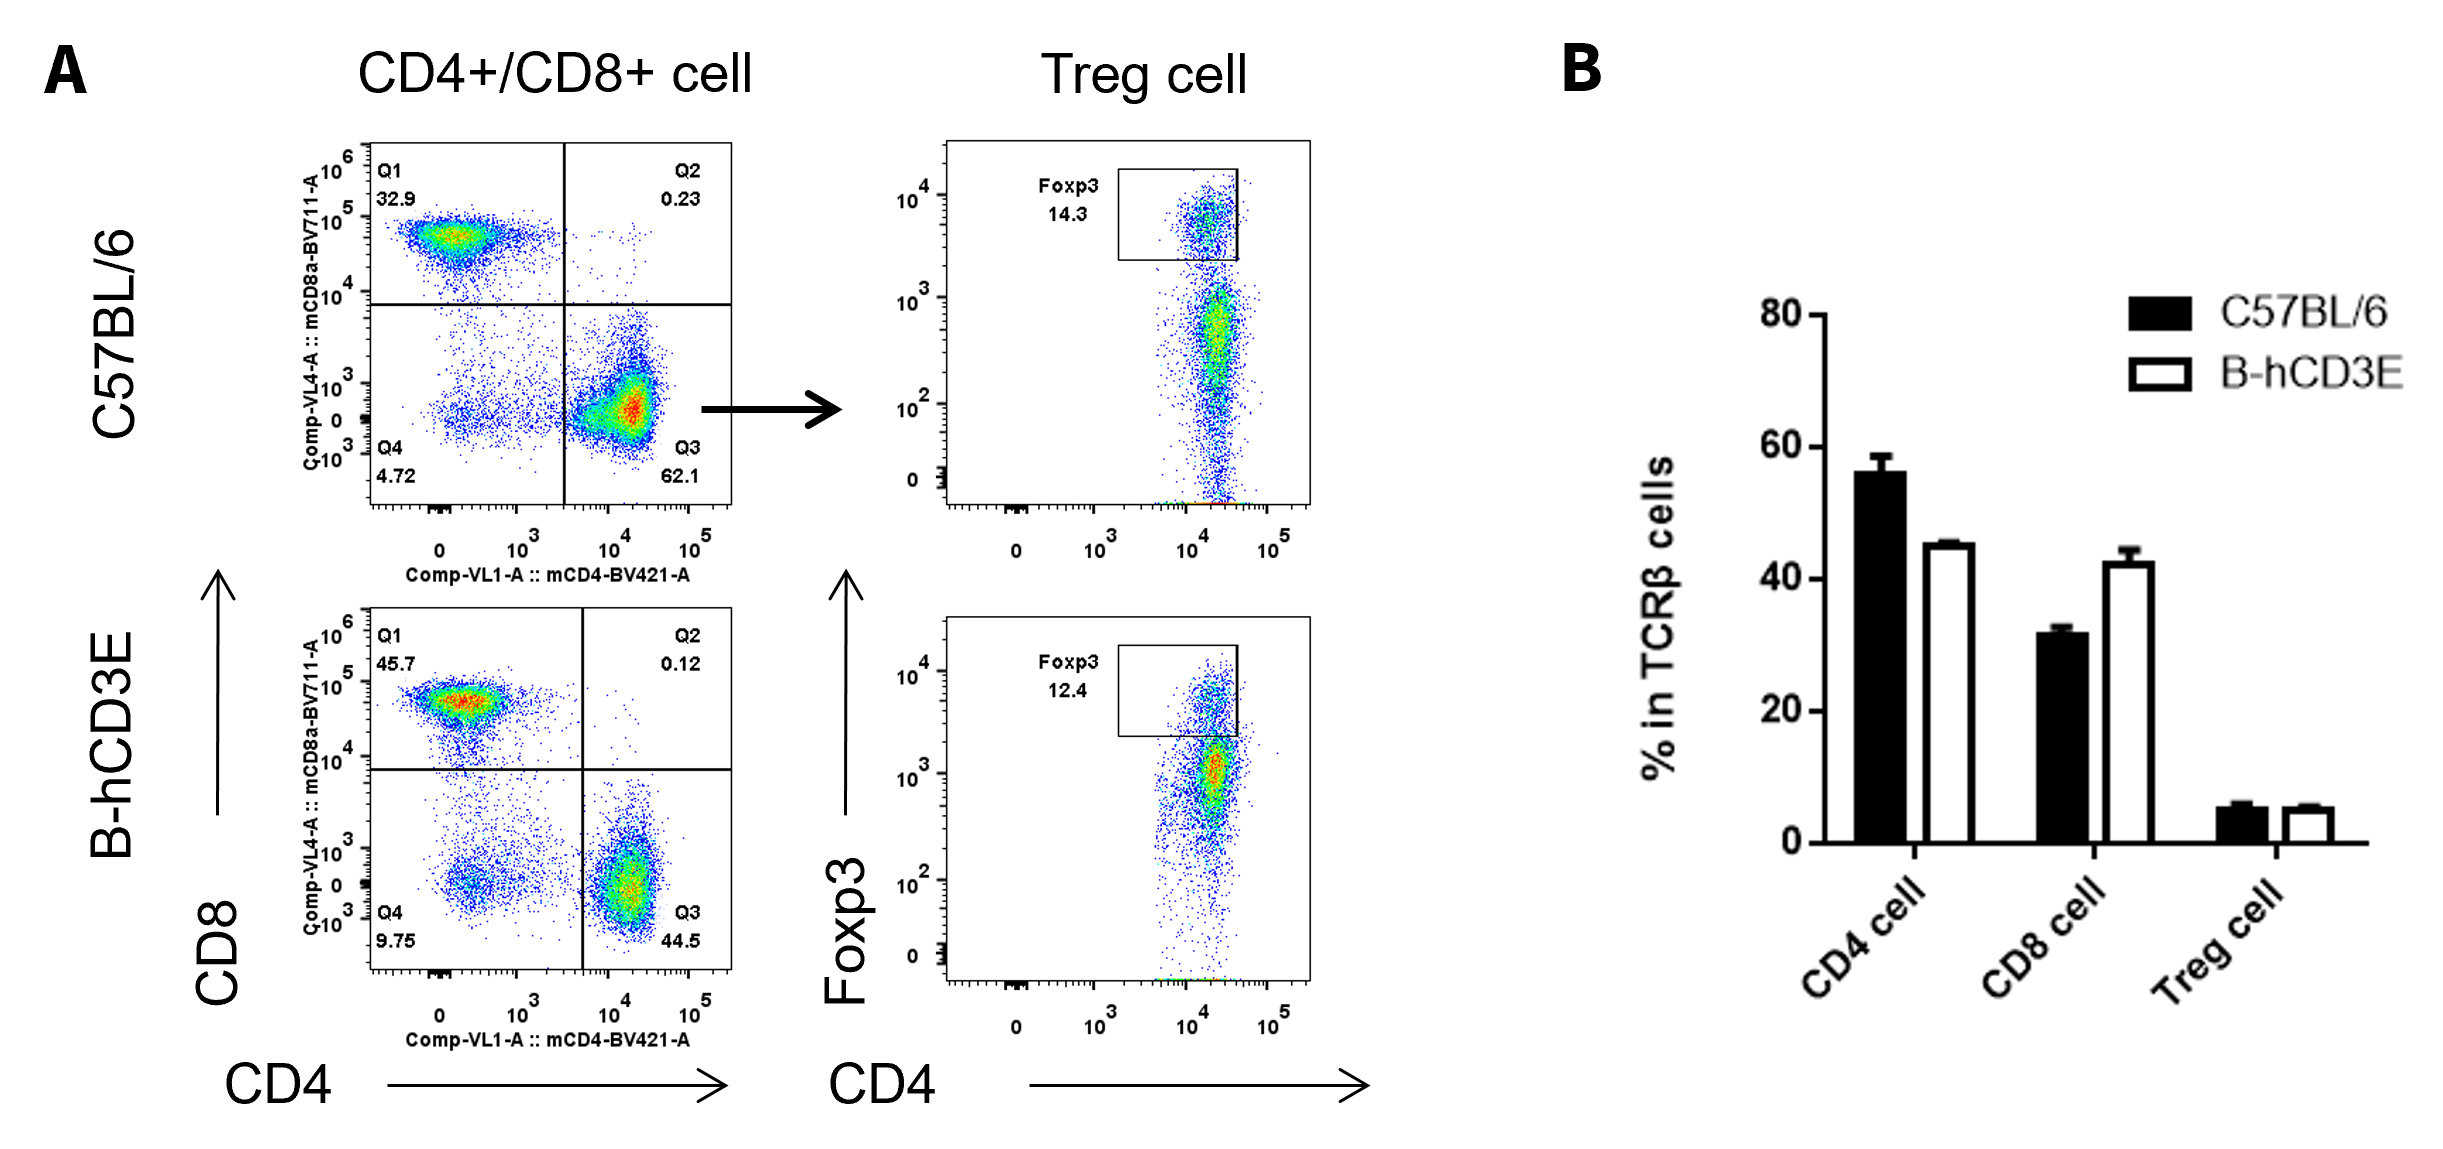
Analysis of T-cell subpopulations by flow cytometry in immune organs. Splenocytes were isolated from female C57BL/6 and B-hCD3E mice (n=3, 6-week-old). Flow cytometry analysis of the splenocytes was performed to assess leukocyte subpopulations. A. Representative FACS plots. Single live CD45+ cells were gated for TCRβ+ T cell population and used for further analysis as indicated here. B. Results of FACS analysis. Values are expressed as mean ± SEM.
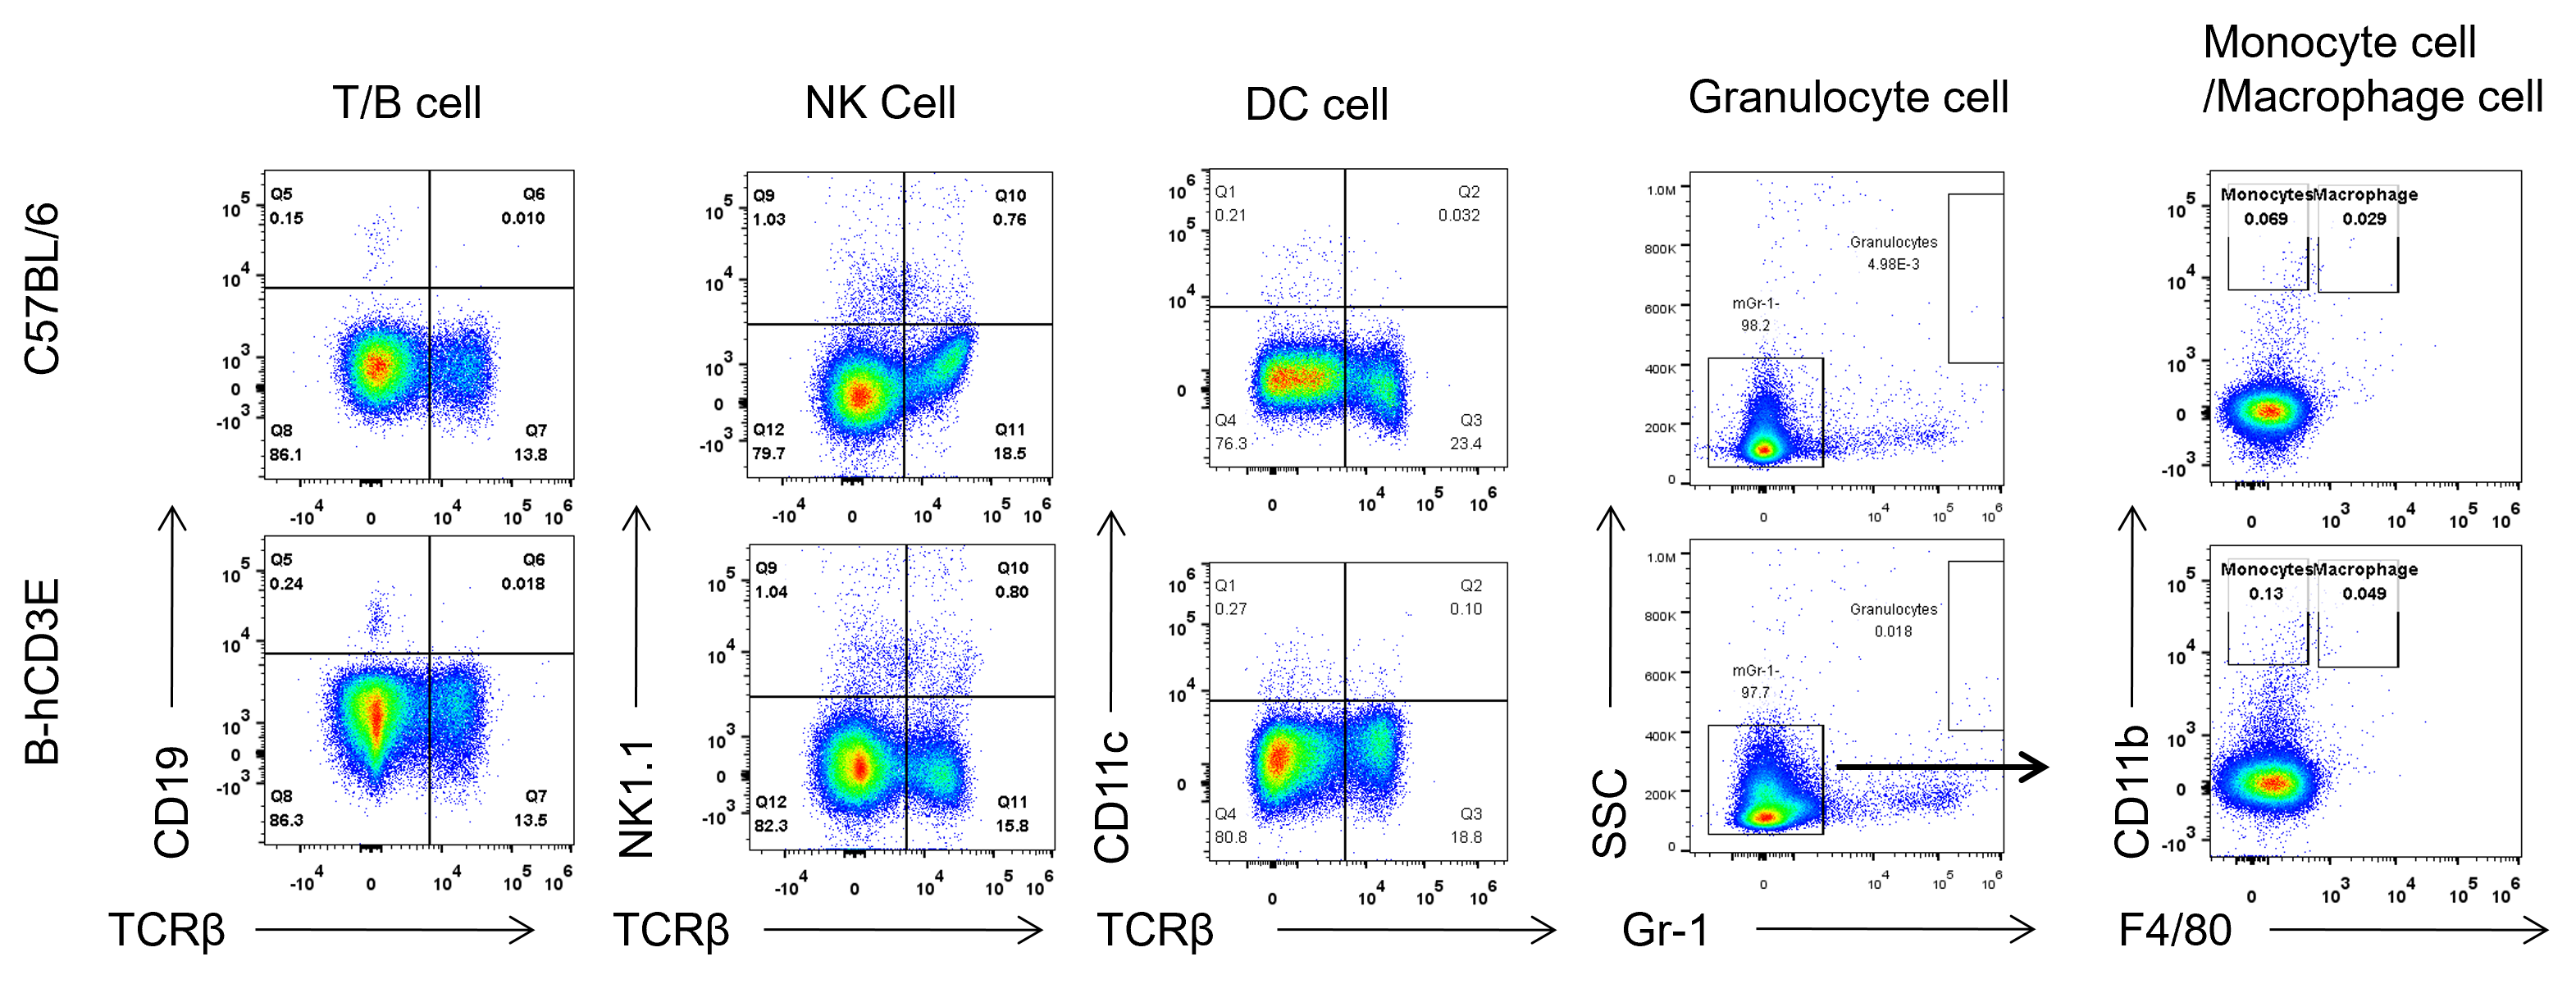
Analysis of leukocyte subpopulations by flow cytometry in immune organs. Thymocytes were isolated from female C57BL/6 and B-hCD3E mice (n=3, 6-week-old). Flow cytometry analysis of the thymocytes was performed to assess leukocyte subpopulations. Representative FACS plots. Single live cells were gated for CD45+ population and used for further analysis as indicated here.
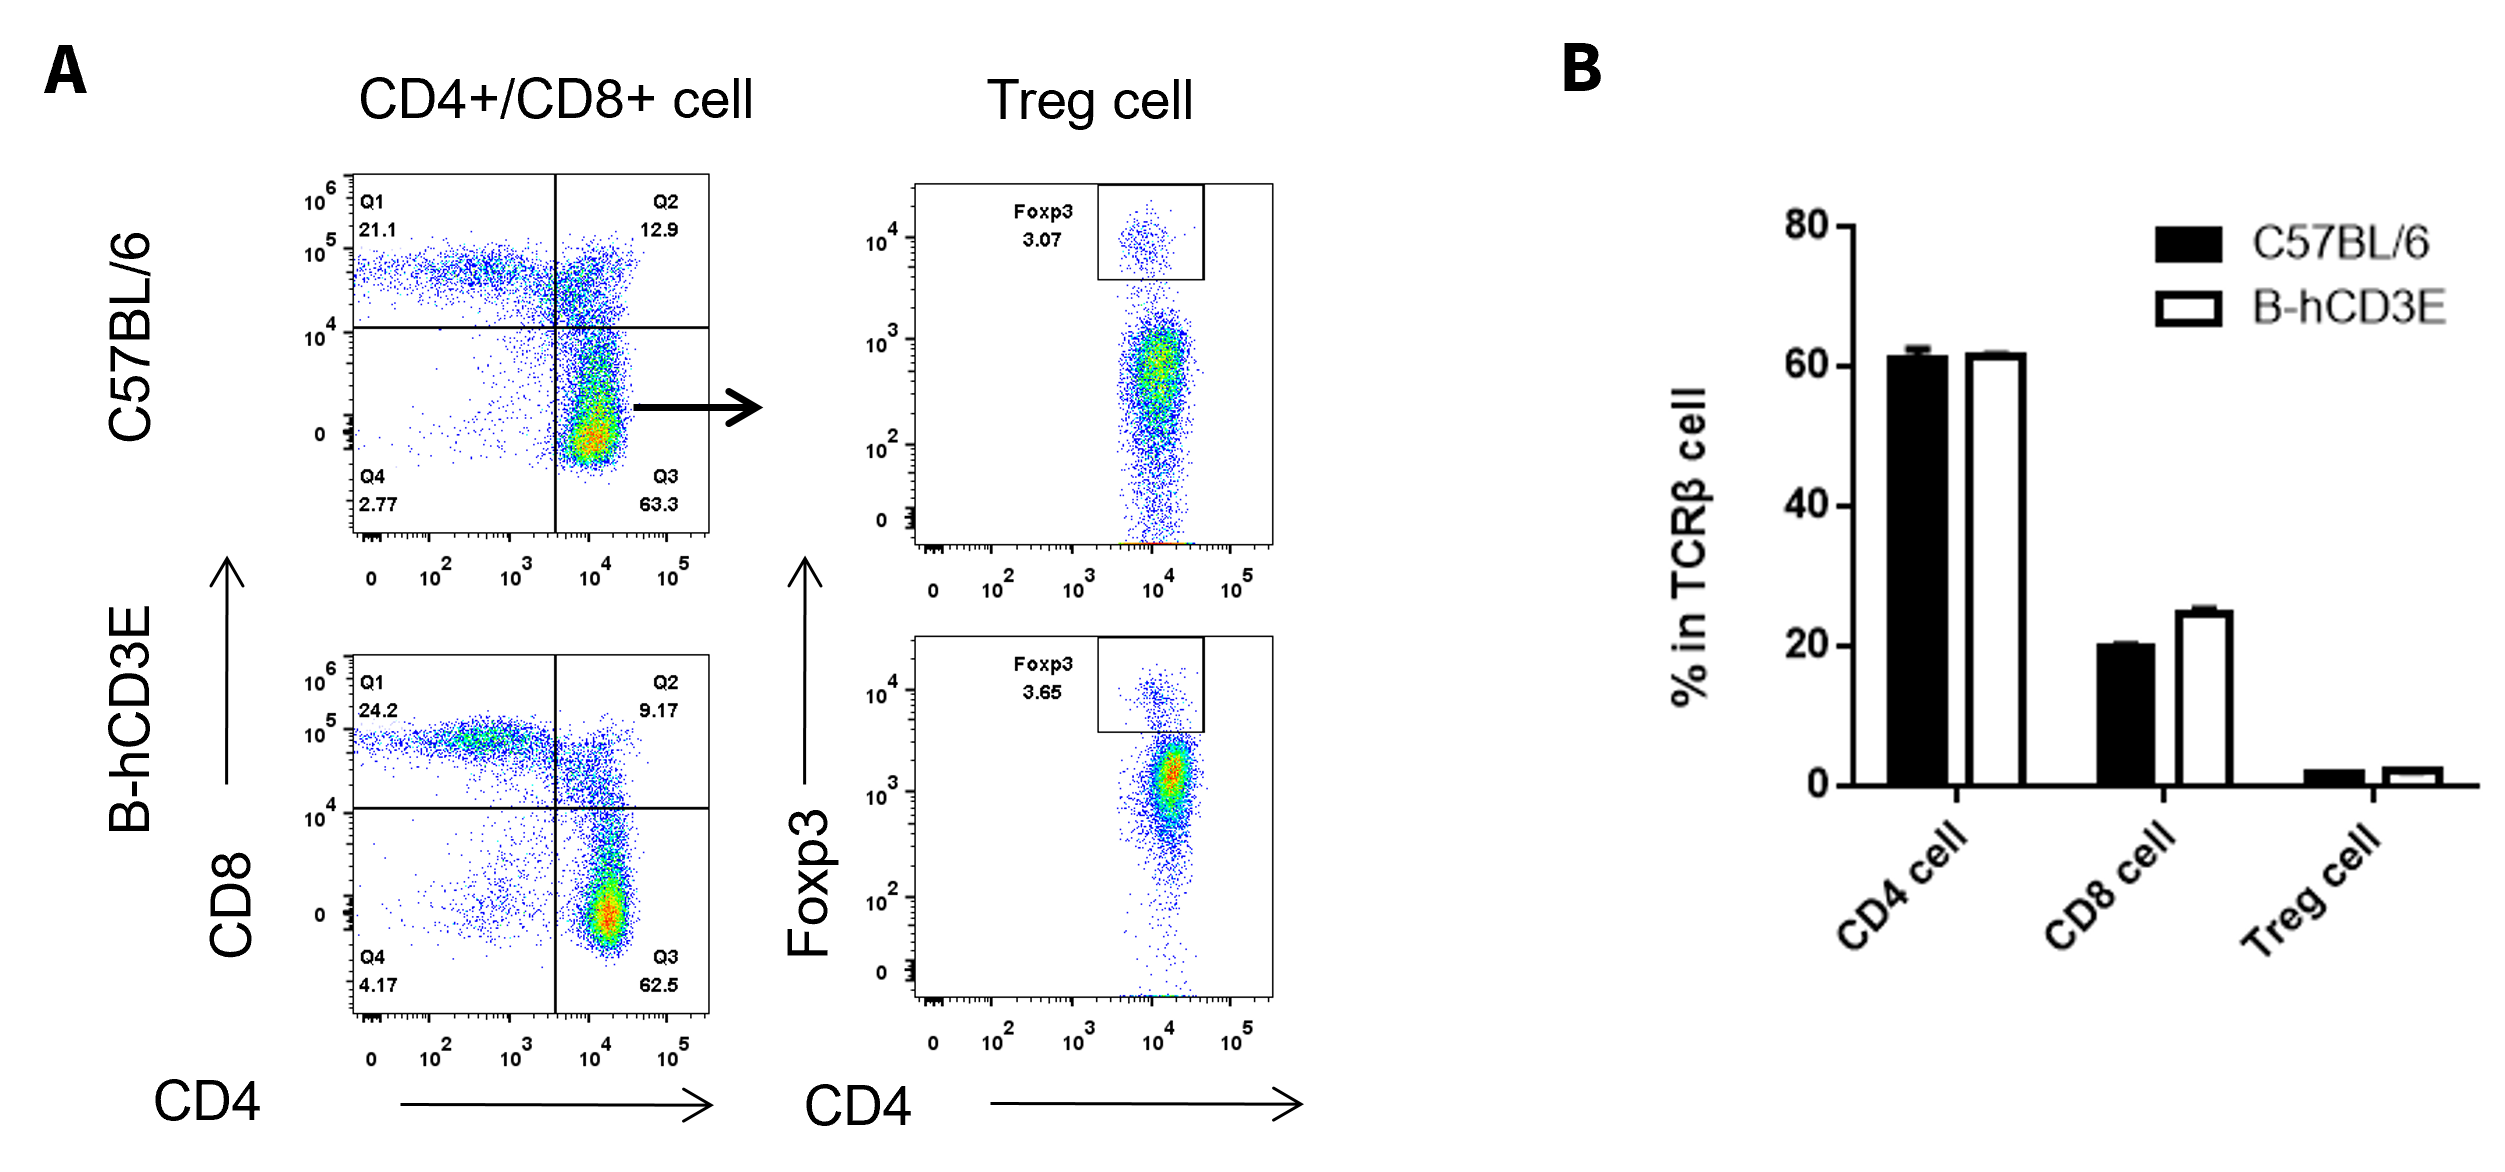
Analysis of T-cell subpopulations by flow cytometry in immune organs. Thymocytes were isolated from female C57BL/6 and B-hCD3E mice (n=3, 6-week-old). Flow cytometry analysis of the thymocytes was performed to assess leukocyte subpopulations. A. Representative FACS plots. Single live CD45+ cells were gated for TCRβ+ cell population and used for further analysis as indicated here. B. Results of FACS analysis. Values are expressed as mean ± SEM.
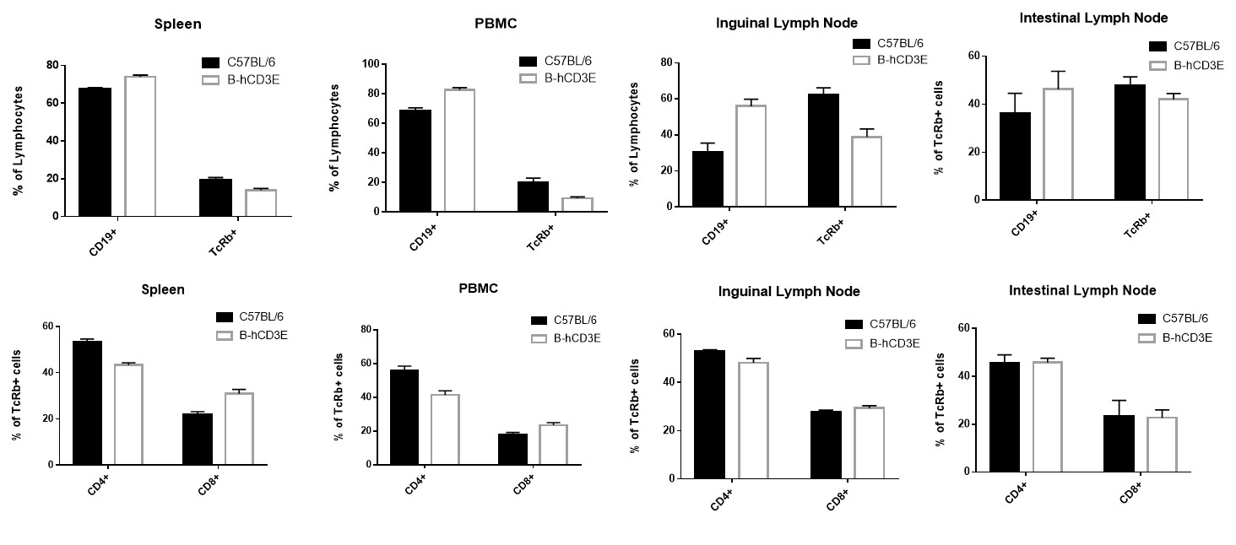
Analysis of T-cell and B-cell subpopulations by flow cytometry in immune organs and blood. Lymphocytes were isolated from spleen, peripheral blood and lymph node of C57BL/6 and B-hCD3E mice (n=4). Flow cytometry analysis was performed to assess lymphocytes subpopulations. Single live cells were gated for CD45 population and used for further analysis as indicated here.
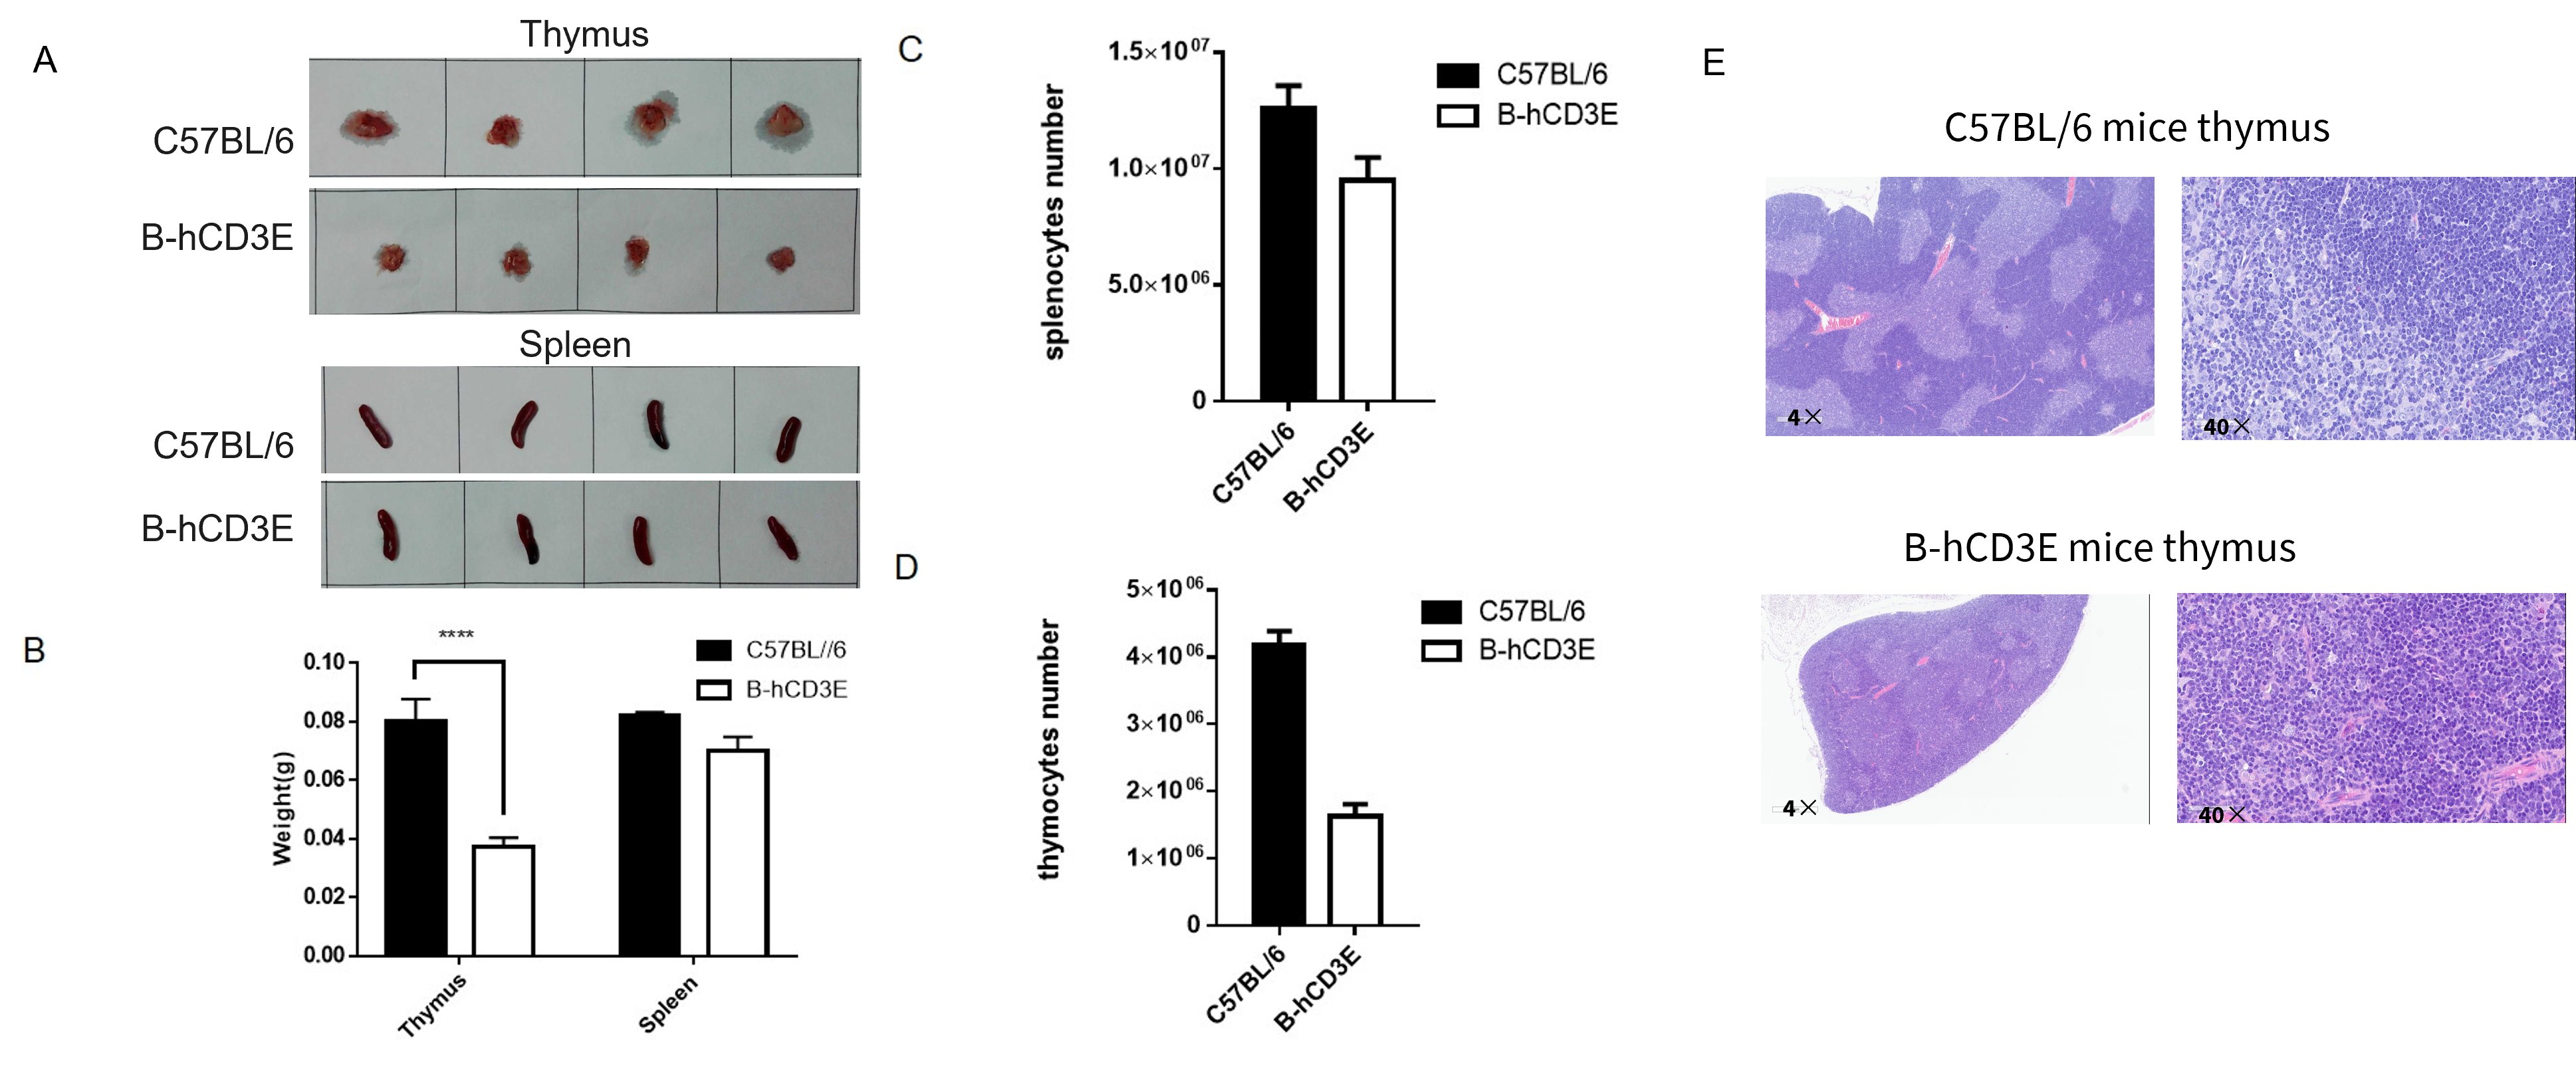
(A, B) Thymus and spleen were isolated and weighed from C57BL/6 and B-hCD3E mice (n=6). The thymus weight in B-hCD3E mice is significantly lower than that of C57BL/6 mice. (C) The number of splenocytes in C57BL/6 and B-hCD3E mice was similar. (D) The number of thymocytes in B-hCD3E mice was significantly lower than that in C57BL/6. (E) The thymus of B-hCD3E mice (female, 8-week-old, n=3) showed no significant abnormal changes, with clear boundaries between the cortex and medulla and normal cell morphology.
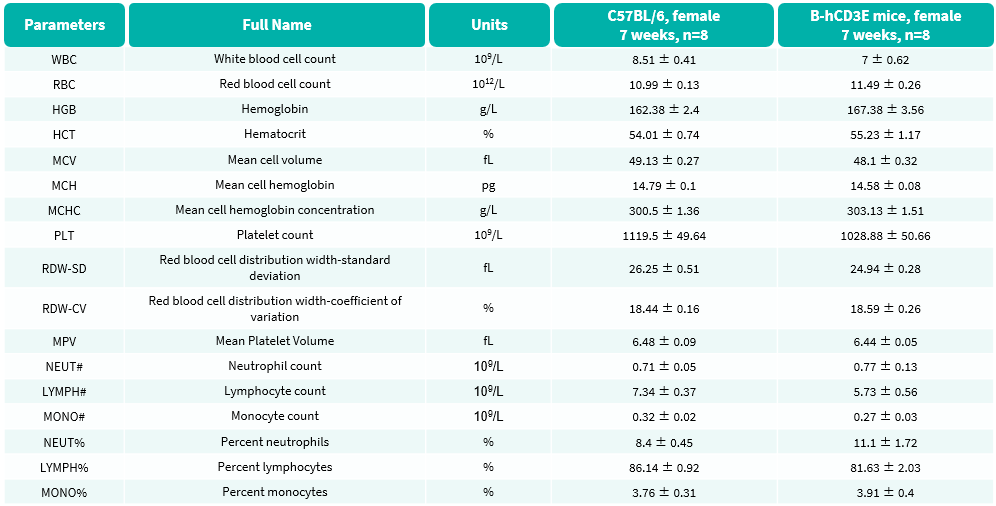
Complete blood count (CBC) of B-hCD3E mice. Values are expressed as mean ± SEM.
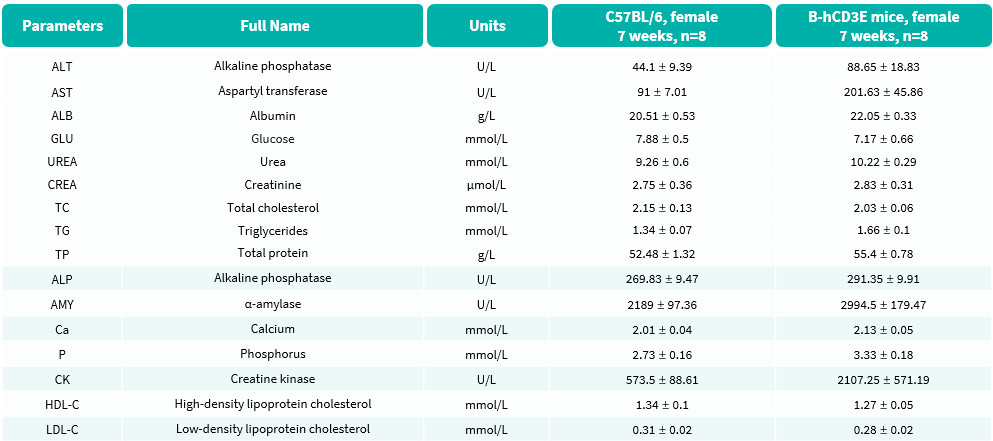
Blood biochemical parameters of B-hCD3E mice are shown. Values are expressed as mean ± SEM.

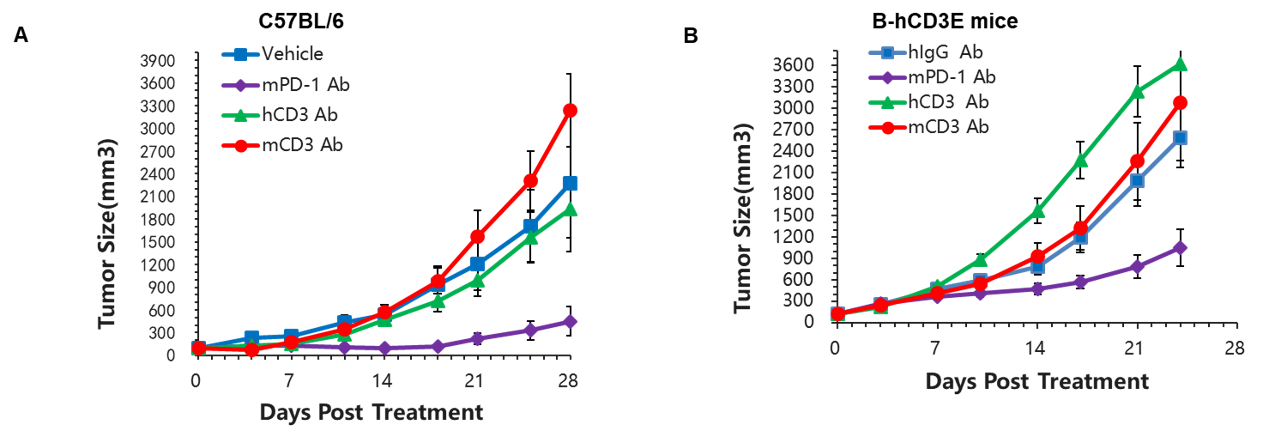
Efficacy of anti-CD3ε antibody and anti-PD-1 antibody in B-hCD3E mice. Murine colon cancer MC38 cells were subcutaneously implanted into C57BL/6 mice (A) and B-hCD3E mice (B). Mice were grouped when the tumor size was approximately 150±50mm3 (n=5). In B-hCD3E mice, mPD-1 antibody (Purchase from BioXCell) significantly inhibited tumor growth, indicating their T cells function normally. However, in B-hCD3E mice, tumor growth was faster after anti-hCD3E antibody (Teplizumab, in house) treatment, which may be caused by activation induced cell death (AICD). As a result, the B-hCD3E mouse model is a powerful tool for in vivo CD3 antibody pharmacological efficacy studies.
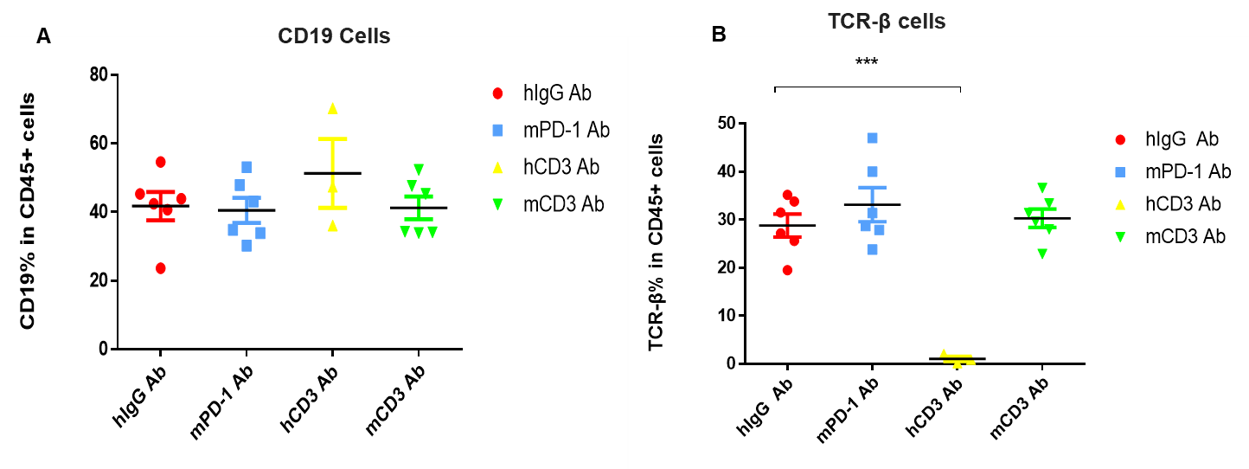
T cells and B cells analysis. Lymphocytes were isolated from peripheral blood at 48 hours after treatment. In the anti-hCD3 antibody (Teplizumab, in house) treatment group, the proportion of T cells was significantly decreased due to the activation induced cell death (AICD) effect caused by CD3E antibody treatment. However, the proportion of T cells has no significant change in the anti-mPD-1 antibody group (Purchase from BioXCell). (A) Compared with hlgG Ab , there is no significant difference in the percentage of CD19+ cells in total CD45+ cells after hCD3 Ab or mCD3 Ab treatment. (B) Compared with hlgG Ab, the percentage of TCR-β positive cells was significantly decreased after treatment with hCD3 Ab in the humanized mice.
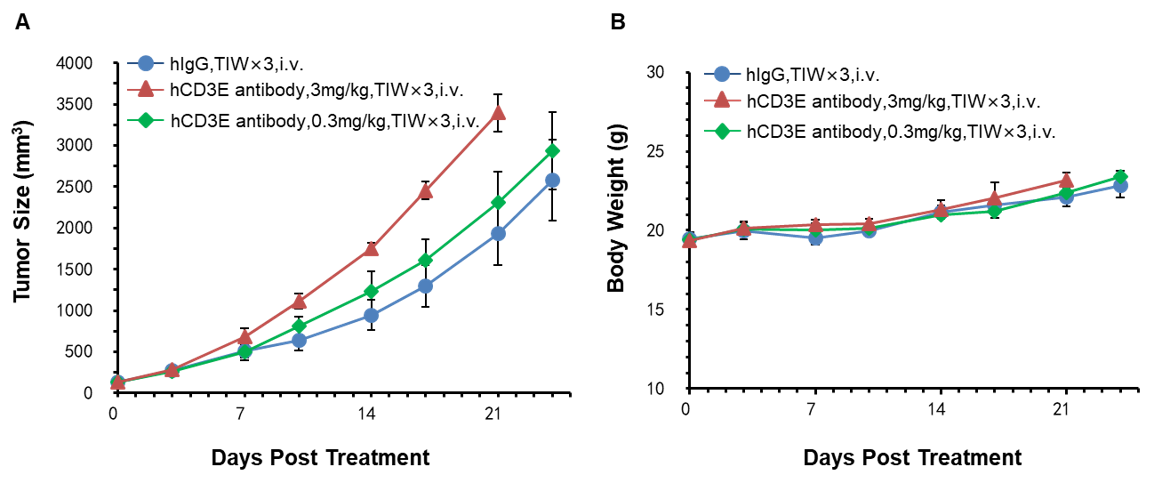
Efficacy of anti-hCD3ε antibody in B-hCD3E mice. Murine colon cancer MC38 cells were subcutaneously implanted into B-hCD3E mice. Mice were divided into control and treatment groups(n=5) when tumor size was approximately 150±50 mm3. High doses of hCD3E antibodies provided by the client resulted in faster tumor growth due to activation induced cell death (AICD), confirming that the B-hCD3E mouse model is a powerful tool for in vivo anti-hCD3 antibody pharmacological efficacy study. (A) Tumor average volume ±SEM, (B) Mice average weight ± SEM.
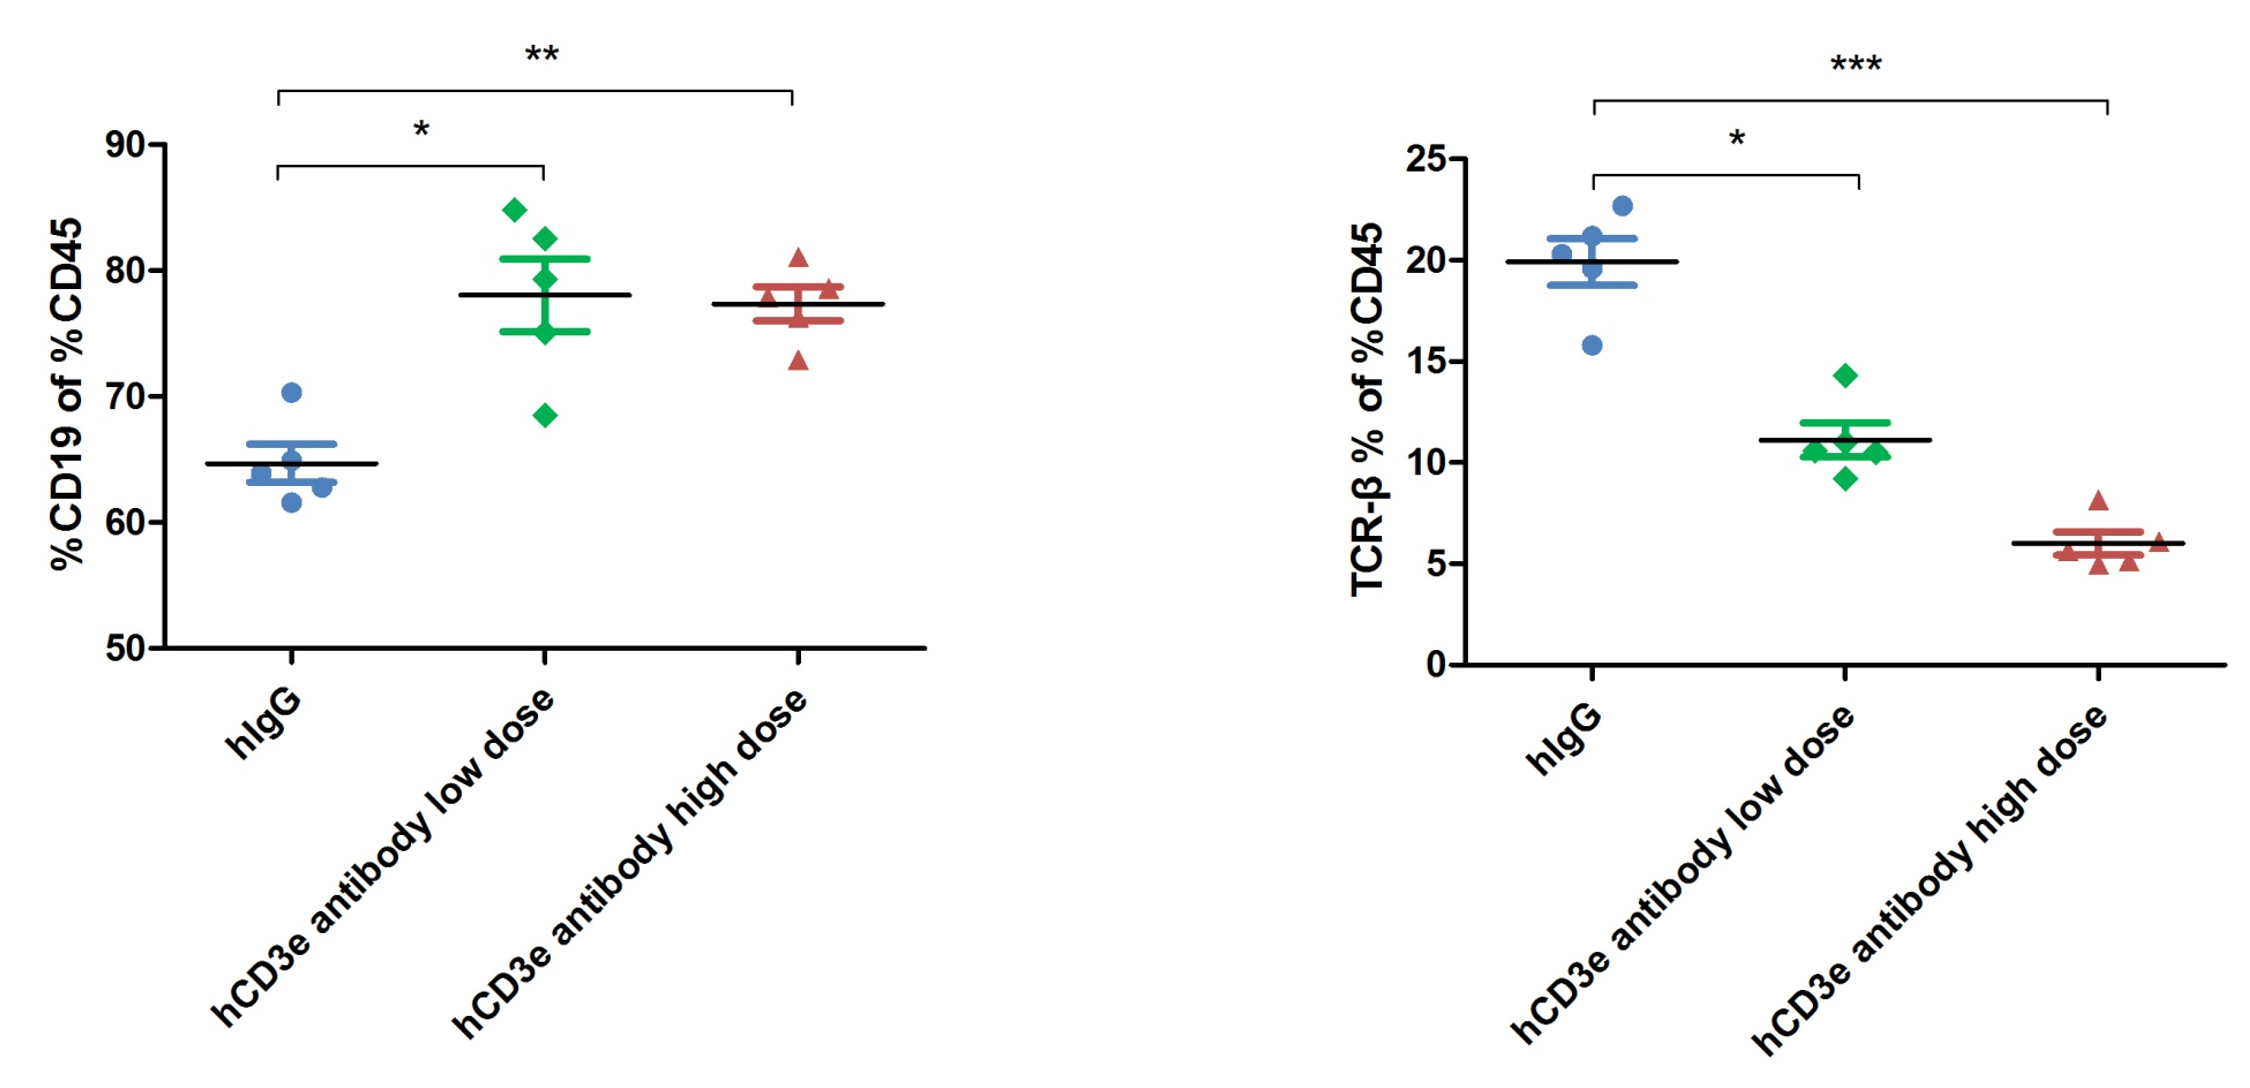
T cells and B cells analysis. The ratio of B and T cells in the blood was detected by flow cytometry. Lymphocytes were isolated from peripheral blood at the end of the experiment. In the treatment group, the proportion of T cells was significantly reduced due to the activation induced cell death (AICD) effect caused by CD3E antibody treatment. Dose-dependent T cell depletion caused by hCD3 Ab treatment.
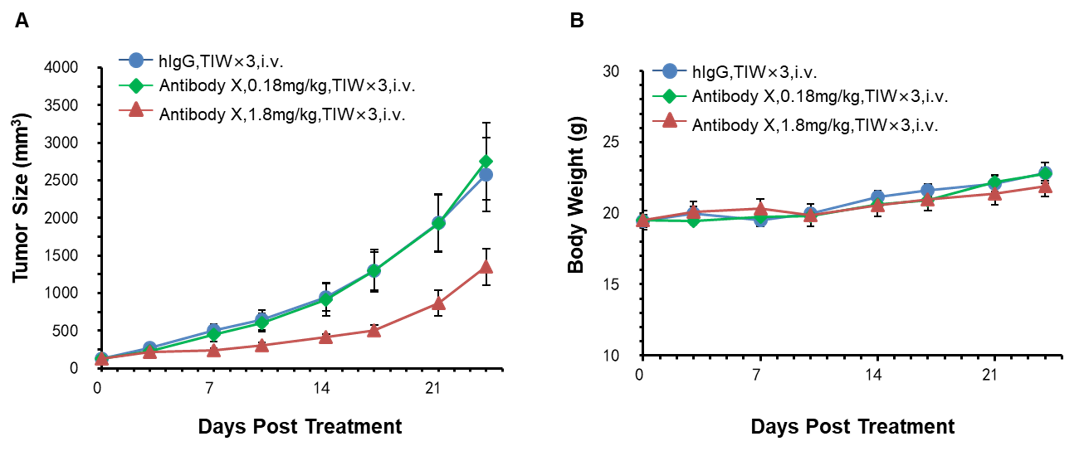
Efficacy of an Antibody(X) in B-hCD3E mice. (A) High-dose Antibody X inhibited MC38 tumor growth in B-hCD3E mice(n=5). Murine colon cancer MC38 cells were subcutaneously implanted into homozygous B-hCD3E mice. Mice were grouped when tumor volume reached approximately 100 mm3, at which time they were treated with Antibody X provided by the client with doses and schedules indicated in panel; (B) Body weight changes during treatment. As shown in panel A, high-dose Antibody X were efficacious in controlling tumor growth in B-hCD3E mice, demonstrating that the B-hCD3E mice provide a powerful preclinical model for in vivo evaluation of Antibody X . Values are expressed as mean ±SEM.
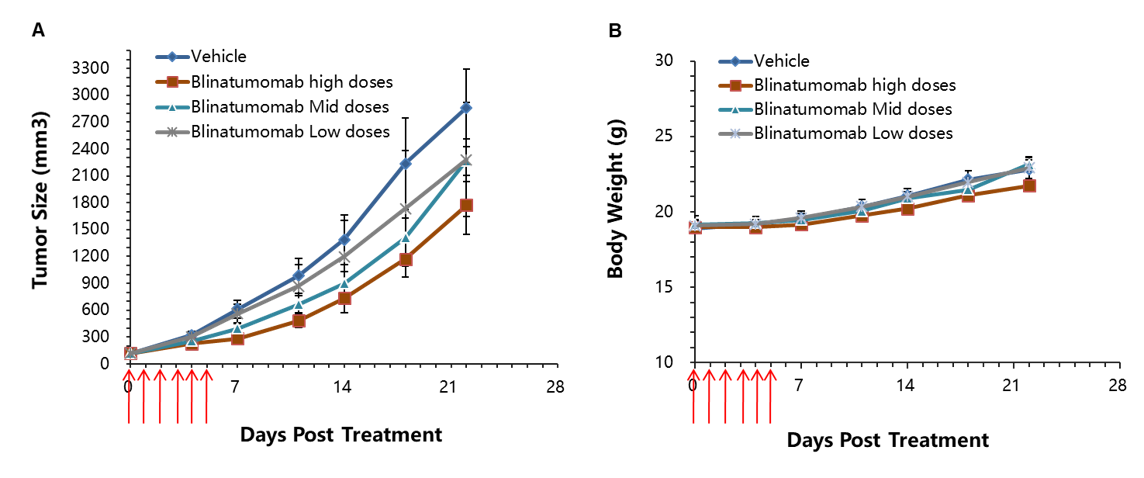
Efficacy of Blinatumomab in B-hCD3E mice. MC38-hCD19 cells were implanted subcutaneously into B-hCD3E mice. The mice were divided into control and treatment groups (n=6) when the tumor size was about 150±50 mm3. High-dose hCD3E antibody (Blinatumomab, commercially available) significantly inhibited tumor growth, confirming that the B-hCD3E mouse model is a powerful tool for evaluating the efficacy of bispecific antibody against hCD3E in vivo.(A) Tumor average volume ± SEM, (B) Mice average weight ±SEM.
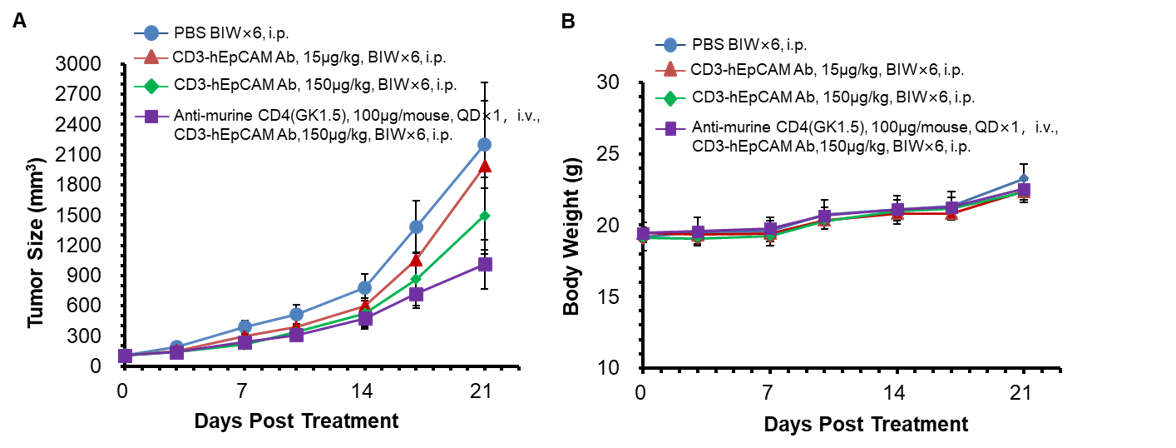
Efficacy of anti-hCD3/hEPCAM BsAbs in B-hCD3E mice. MC38-hEpCAM cells were implanted subcutaneously into B-hCD3E mice. The mice were divided into control and treatment groups when the tumor size was about 100±20 mm3. The results show that the anti-hCD3E/hEpCAM bispecific antibody provided by the client has a moderate degree of antitumor activity compared to the control group. The data also show that anti-mouse CD4 (a CD4-depleting antibody) enhances the antitumor activity of the bispecific anti-hCD3E/hEpCAM antibody.
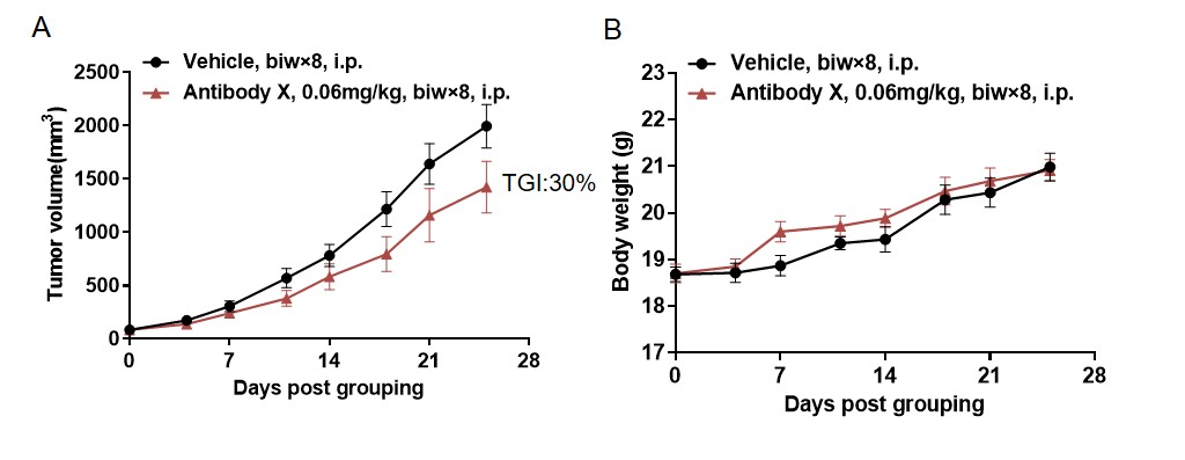
Efficacy of an Antibody(X) in B-hCD3E mice. B-hDLL3 MC38 cells were subcutaneously implanted into B-hCD3E mice (female, 8-week-old, n=6). Mice were grouped when the tumor size was approximately 100 mm3, at which time they were treated with BsAb X provided by the client with doses and schedules indicated in panel. (A) Tumor volume changes during treatment. (B) Body weight changes during treatment. As shown in panel A, BsAb X was efficacious in controlling tumor growth in B-hCD3E mice, demonstrating that the B-hCD3E mouse model is a powerful tool for in vivo efficacy study of T cell bispecific antibody. Values are expressed as mean ± SEM.
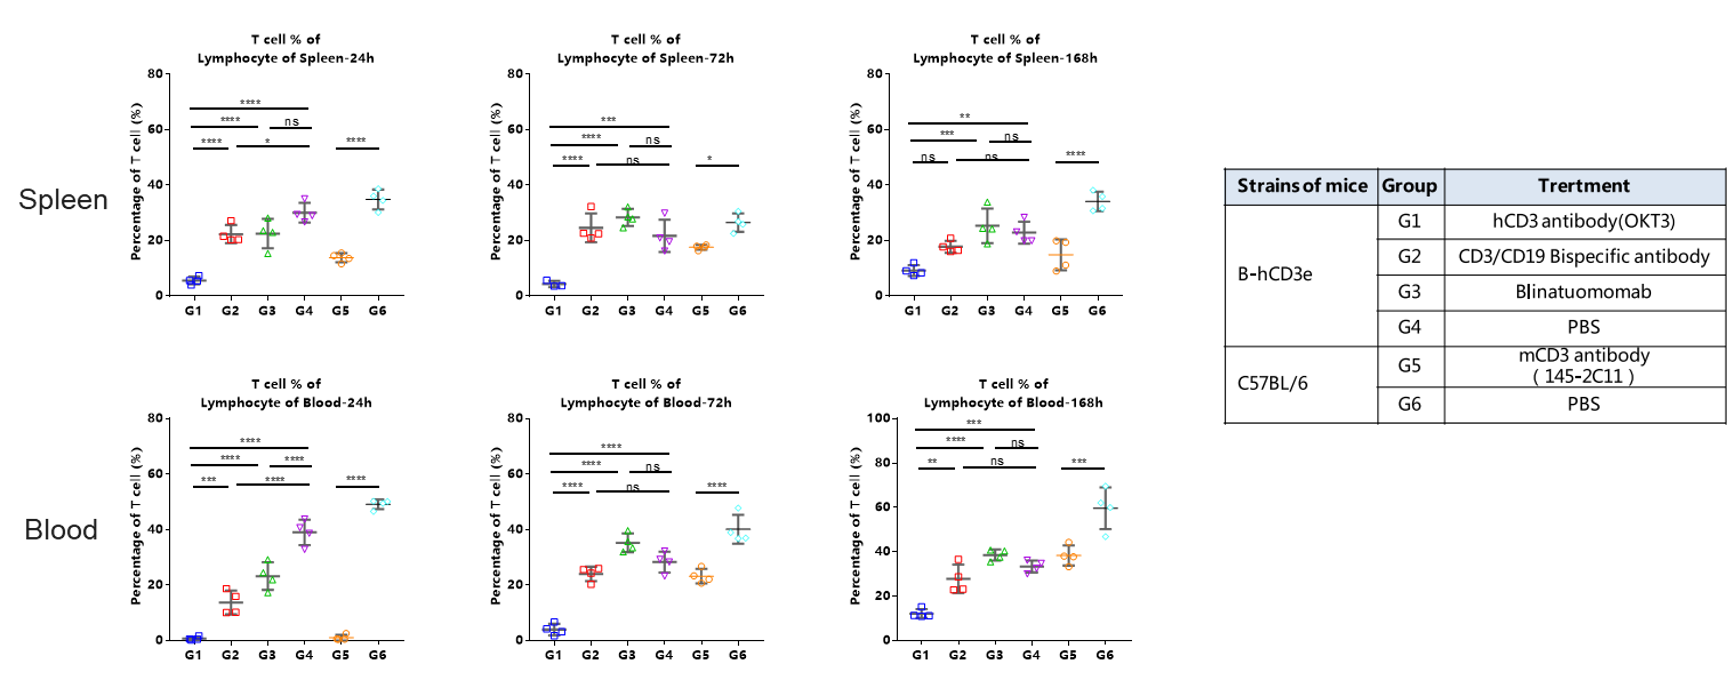
The ratio of T cells in spleen and blood were analyzed at 24h、72 and 168h by flow cytometry.