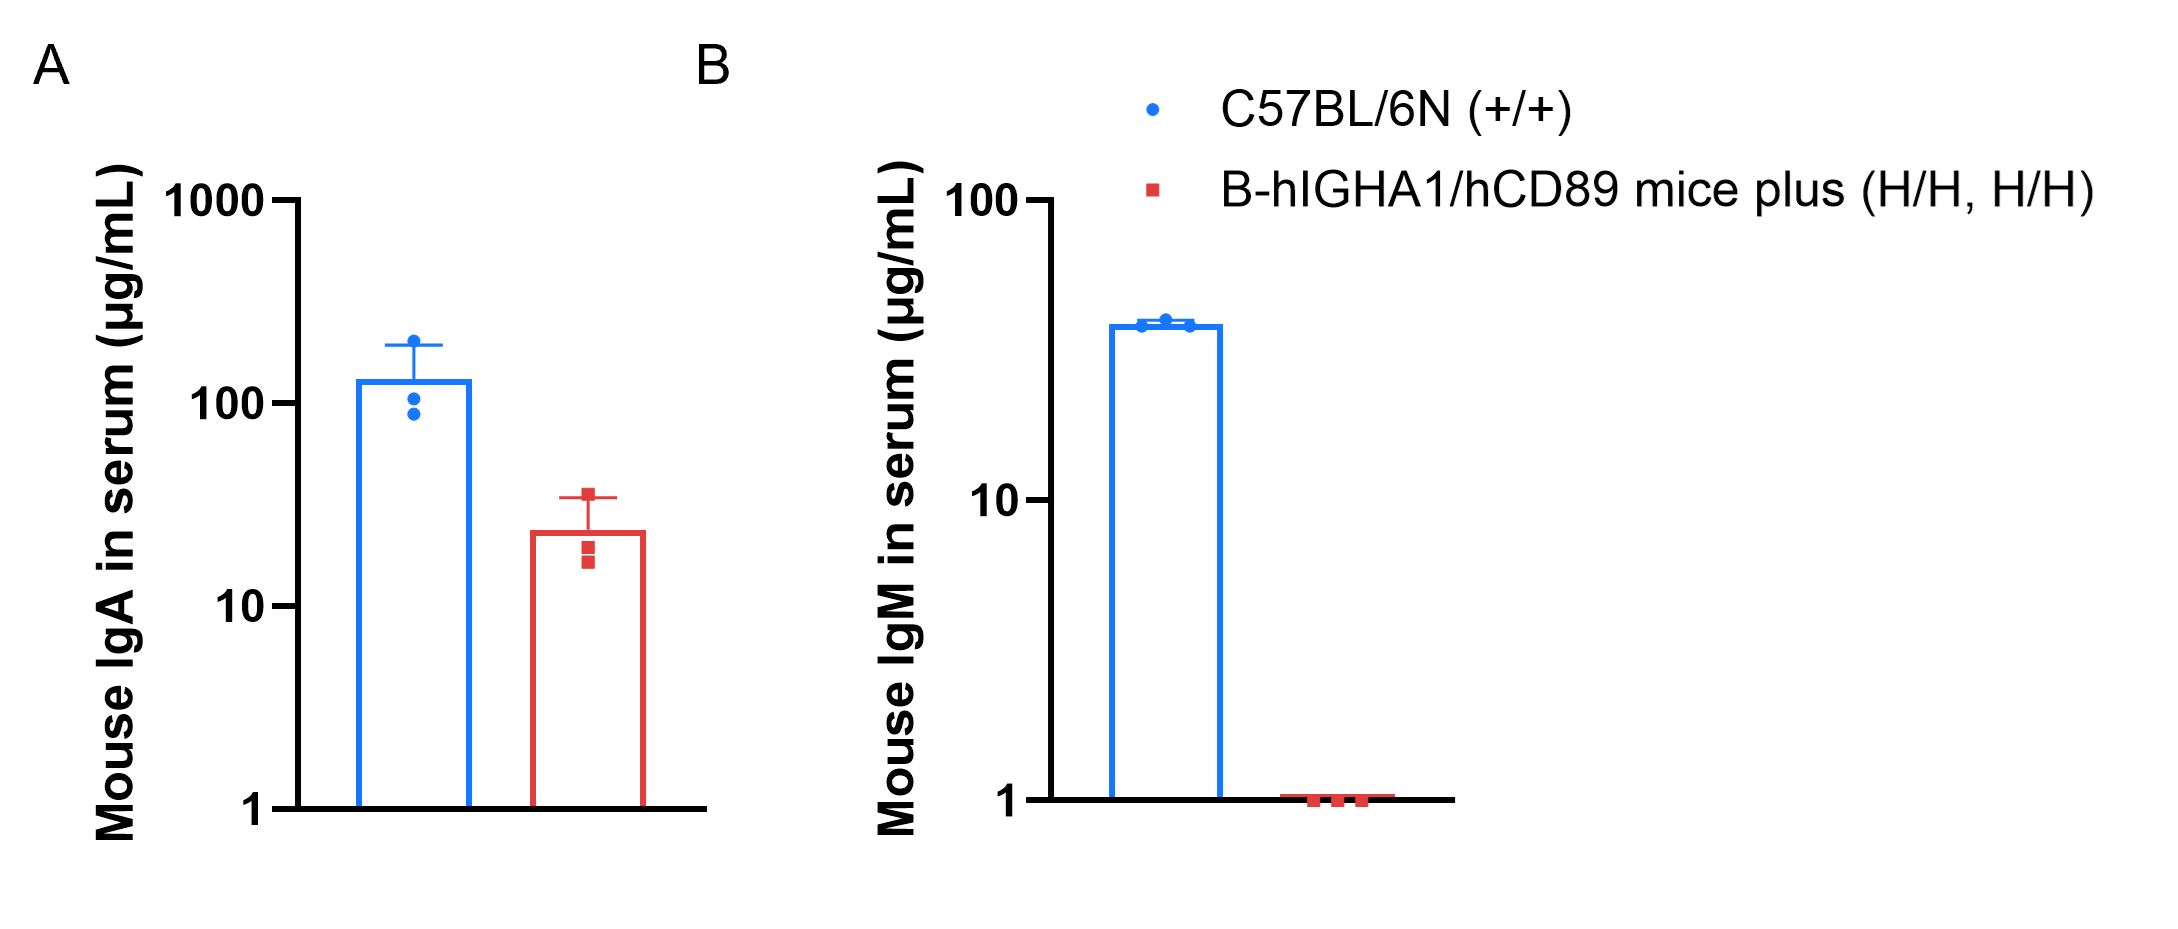
Mouse IgA and IgM Protein Expression Analysis
- (A) Mouse IgA was detectable in wild-type mice and homozygous B-hIGHA1/hCD89 mice plus, but the expression level in homozygous mice was lower than that in wild-type mice.
- (B) Mouse IgM was detectable in in wild-type mice, but not in homozygous B-hIGHA1/hCD89 mice plus.
Mouse immunoglobulin expression analysis in wild-type C57BL/6N mice and homozygous humanized B-hIGHA1/hCD89 mice plus by ELISA. Serum was collected from wild-type C57BL/6N mice (+/+) (male, n=3, 8-week-old) and homozygous humanized B-hIGHA1/hCD89 mice plus (H/H, H/H) (male, n=3, 8-week-old). Expression level of mouse immunoglobulin was analyzed by ELISA (SouthernBiotech SBA Clonotyping System-C57BL/6-HRP: SouthernBiotech, 5300-05B). Values are expressed as mean ± SEM.
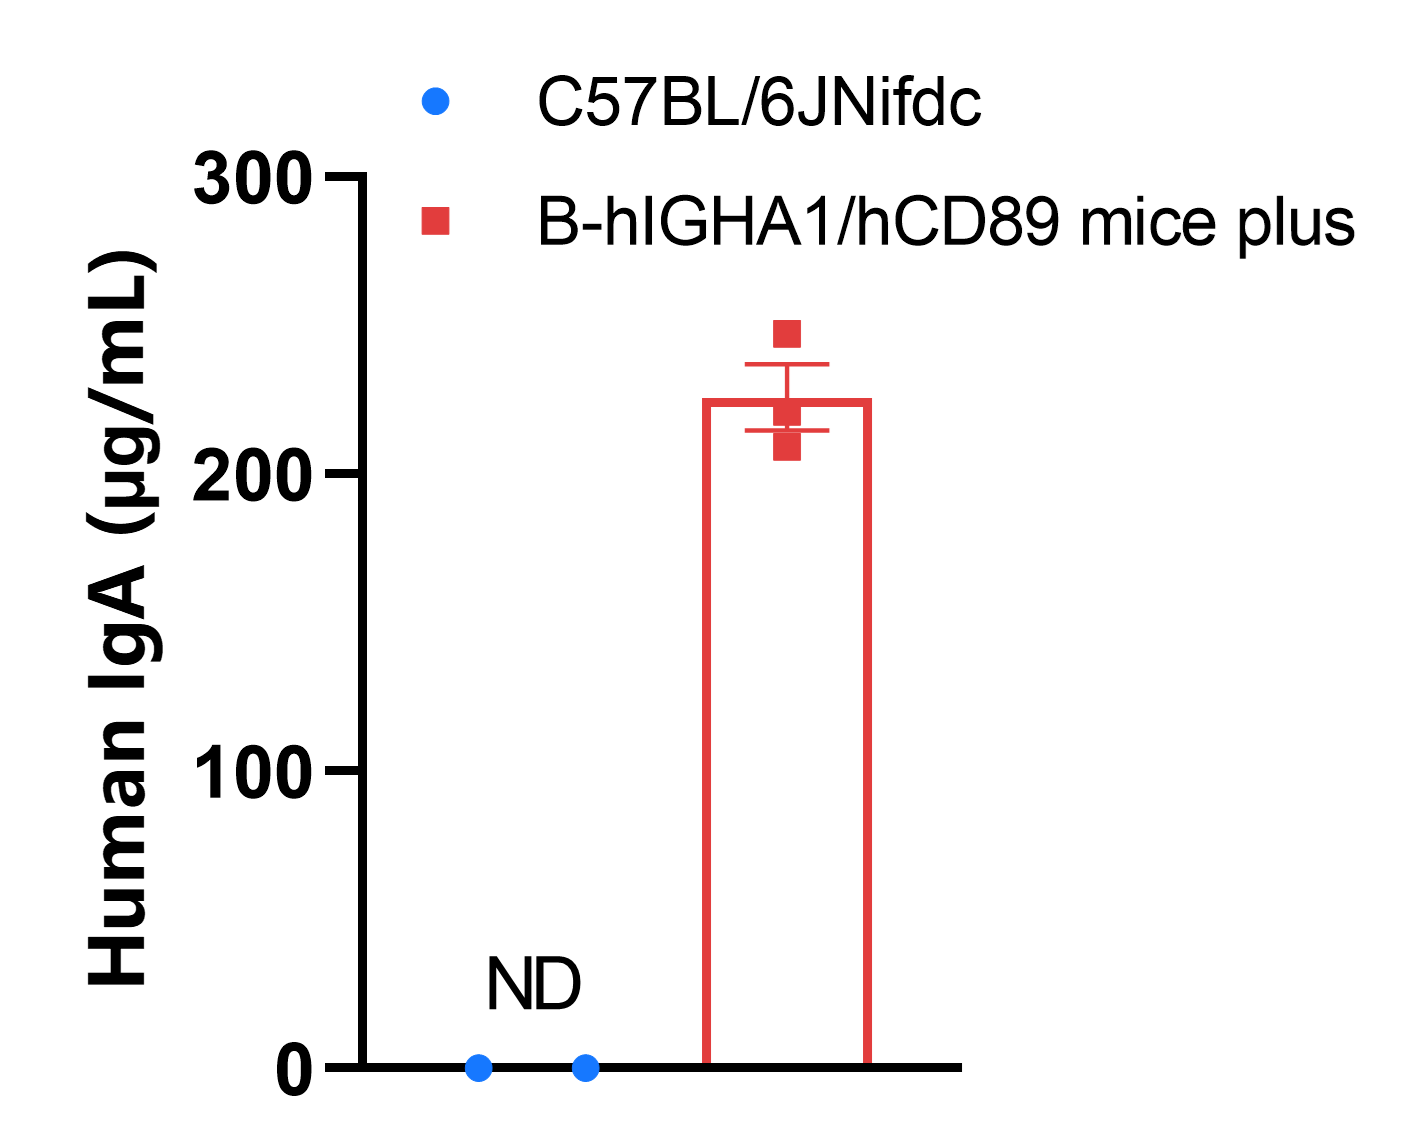
Human IgA Protein Expression Analysis
- Human IgA was exclusively detectable in homozygous B-hIGHA1/hCD89 mice plus but not in wild-type mice.
Strain specific IgA expression analysis in homozygous B-hIGHA1/hCD89 mice plus by ELISA. Serum were collected from wild-type C57BL/6 mice (+/+) (male, n=3, 8-week old) and homozygous B-hIGHA1/hCD89 mice plus (H/H) (male, n=3, 8-week old), and analyzed by ELISA with species-specific anti-IgA ELISA kit (human IgA: abcam, ab196263).
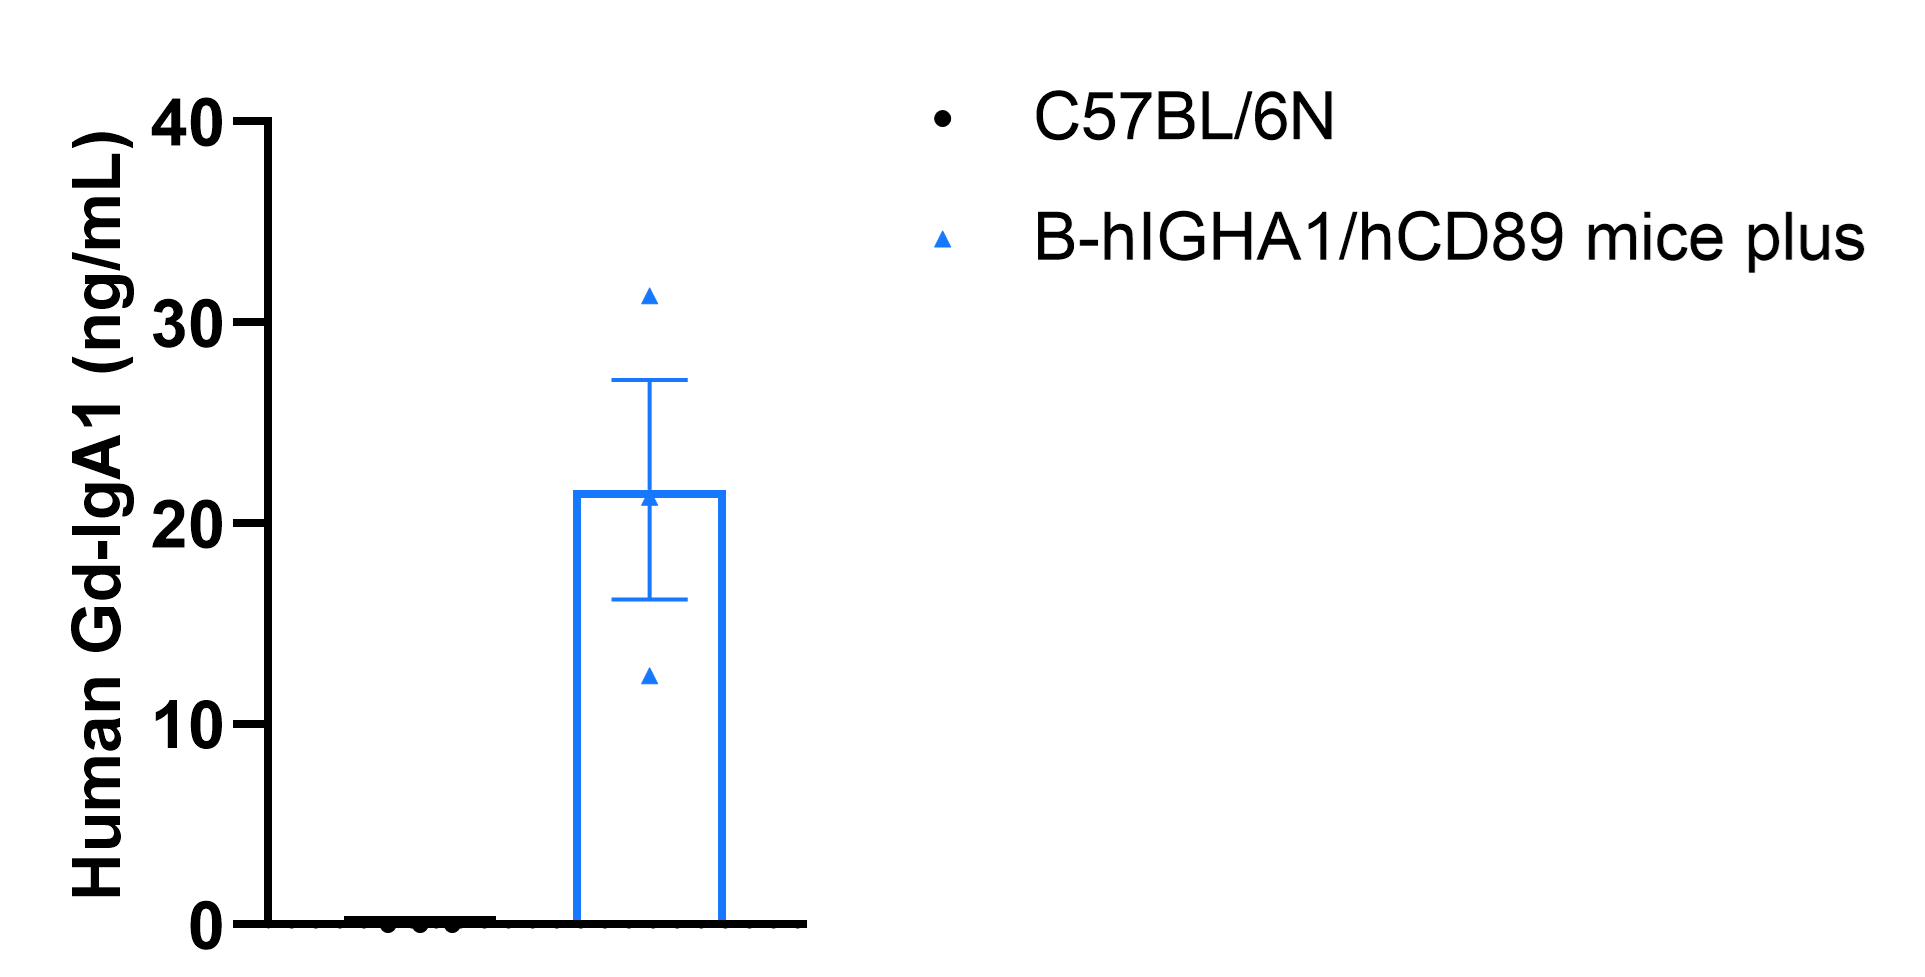
Human Gd-IgA1 Protein Expression Analysis
- Human Gd-IgA1 was exclusively detectable in homozygous B-hIGHA1/hCD89 mice plus but not in wild-type C57BL/6N mice.
Strain specific Gd-IgA1 expression analysis in wild-type mice C57BL/6N mice and homozygous B-hIGHA1/hCD89 mice plus by ELISA. Serum were collected from wild-type C57BL/6N mice (+/+) (n=3, 7w, male) and homozygous B-hIGHA1/hCD89 mice plus (H/H) (n=3, 7w, male). Expression level of human Gd-IgA1 was analyzed by ELISA (human Gd-IgA1 ELISA kit: ibl, 27600). Values are expressed as mean ± SEM.
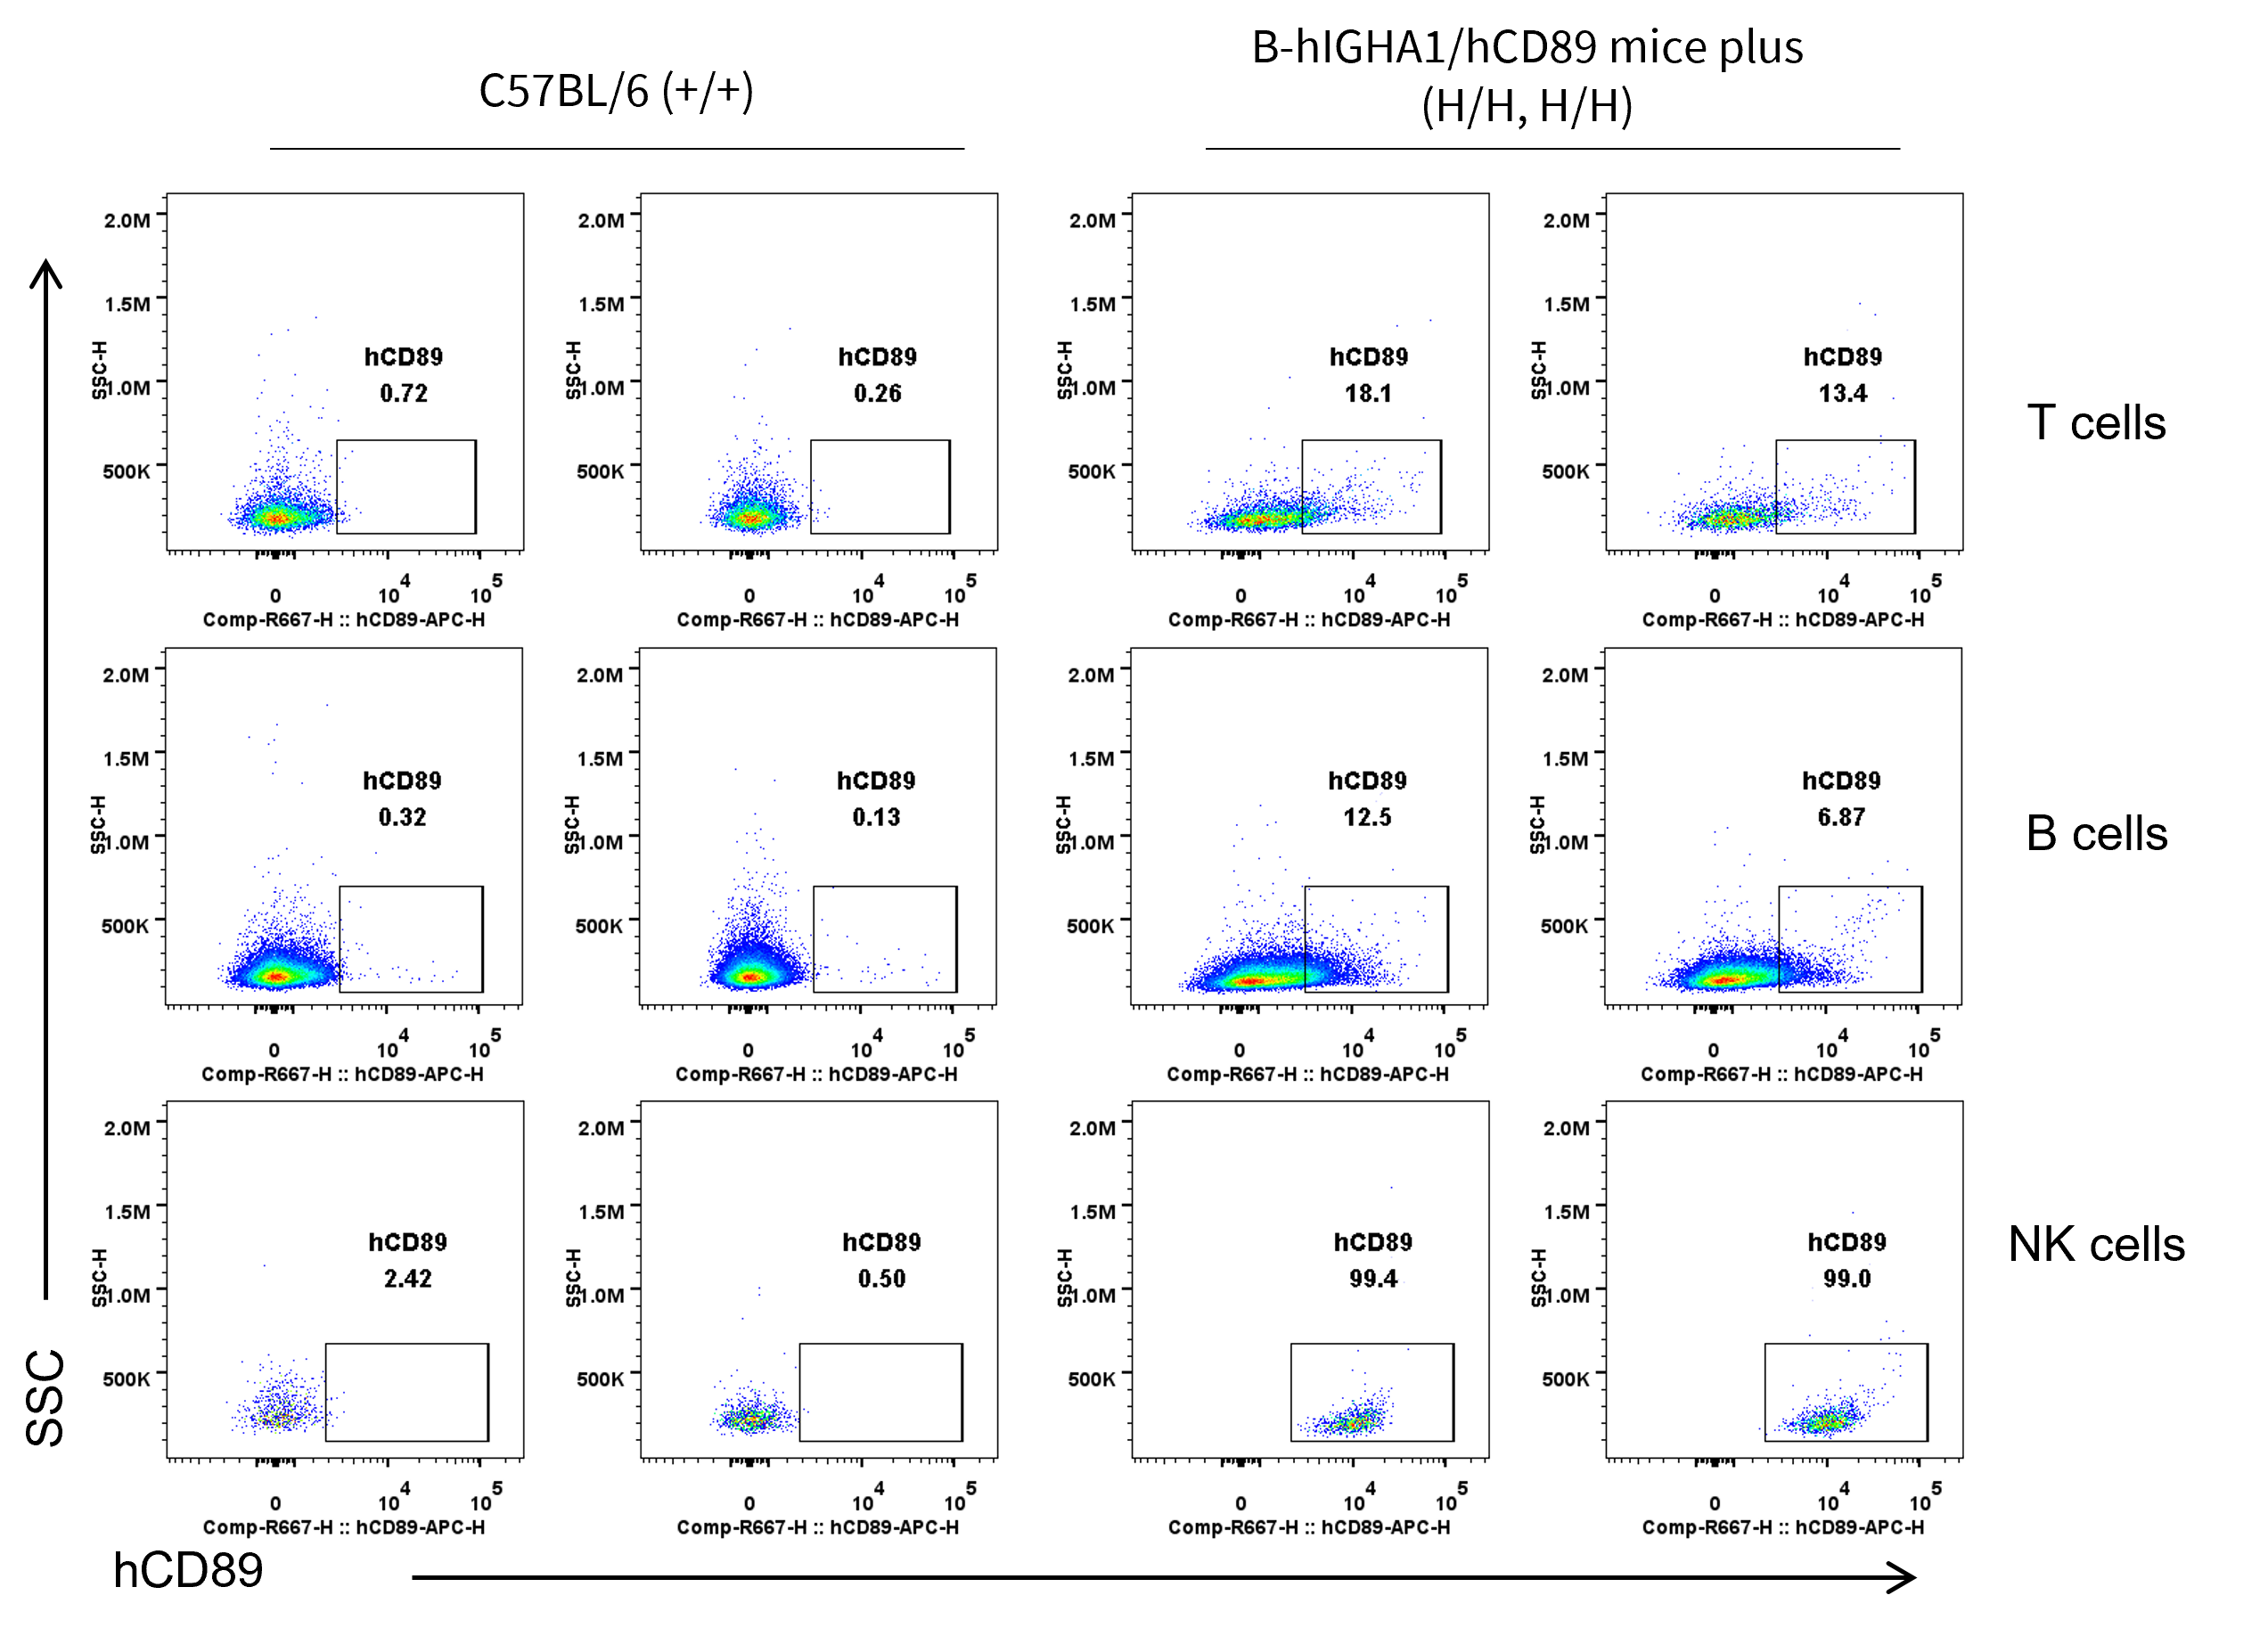
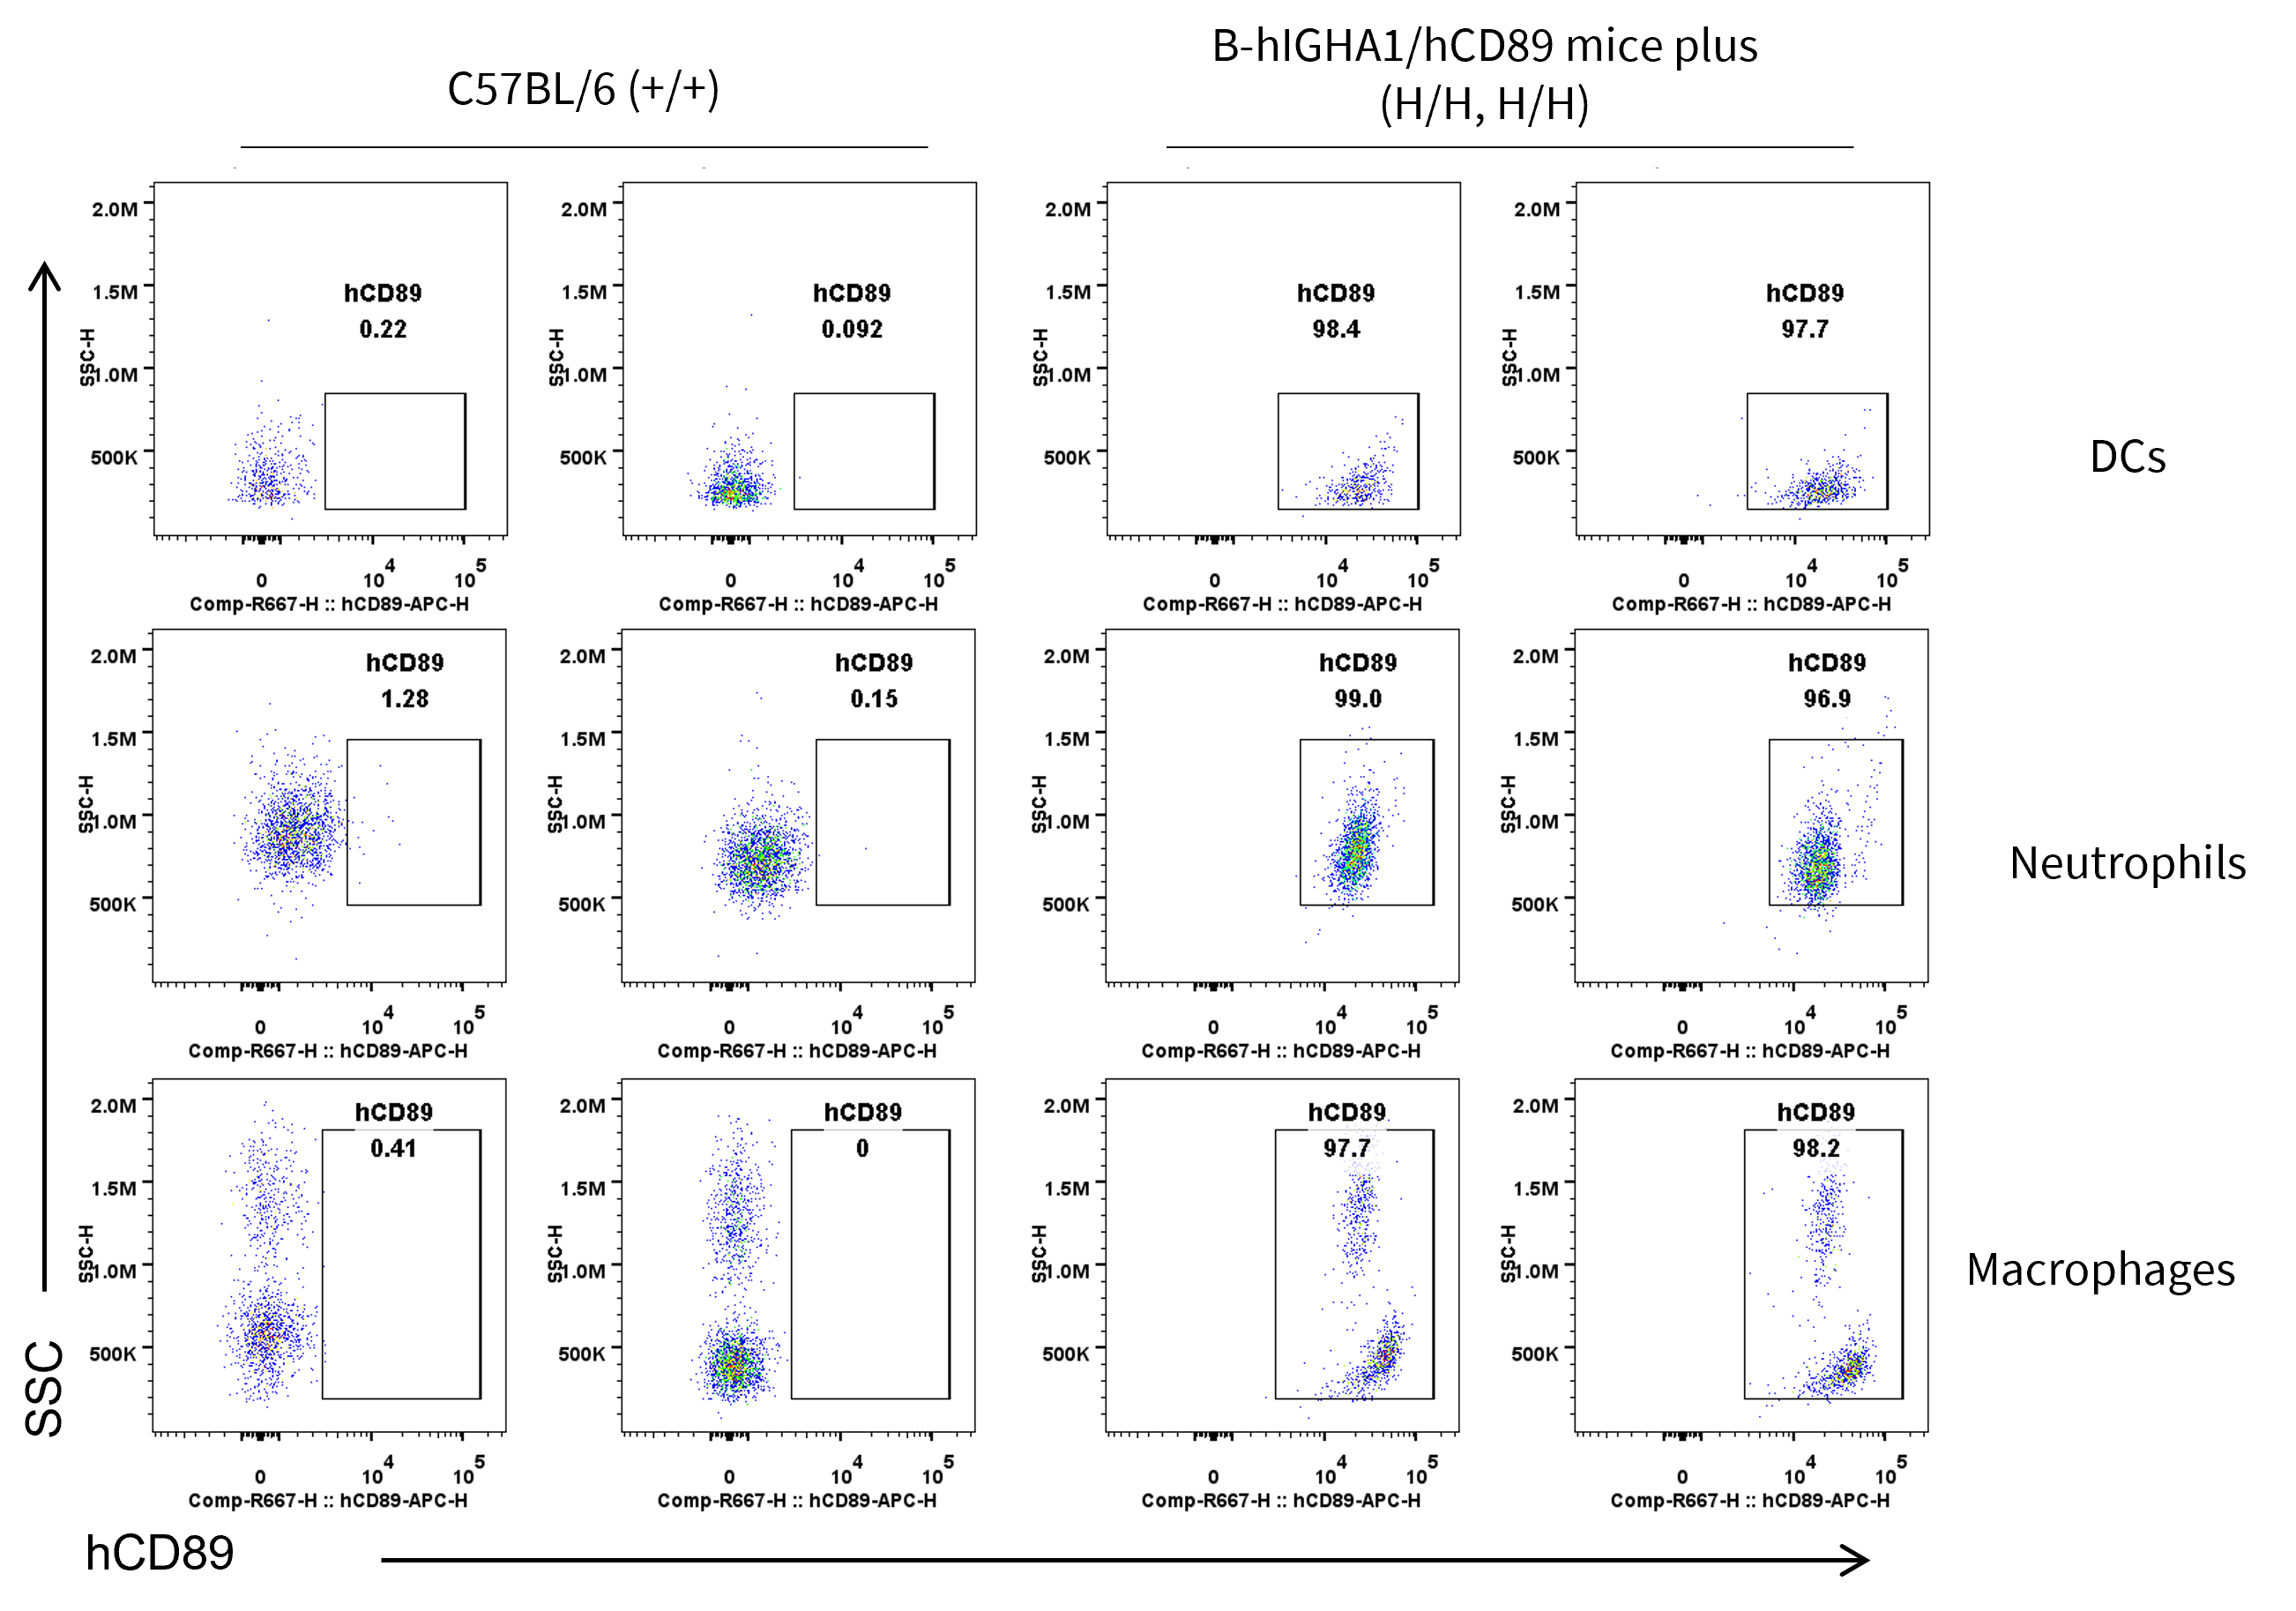
CD89 Protein Expression in Blood
- hCD89 was exclusively detectable in homozygous B-hIGHA1/hCD89 mice plus (H/H, H/H), but not in wild-type C57BL/6 mice.
Strain specific CD89 expression analysis in homozygous B-hIGHA1/hCD89 mice plus by flow cytometry. Blood cells were collected from wild-type C57BL/6 mice (+/+) and homozygous B-hIGHA1/hCD89 mice plus (H/H, H/H), and analyzed by flow cytometry with anti-hCD89 antibody (Biolegend, 354105).
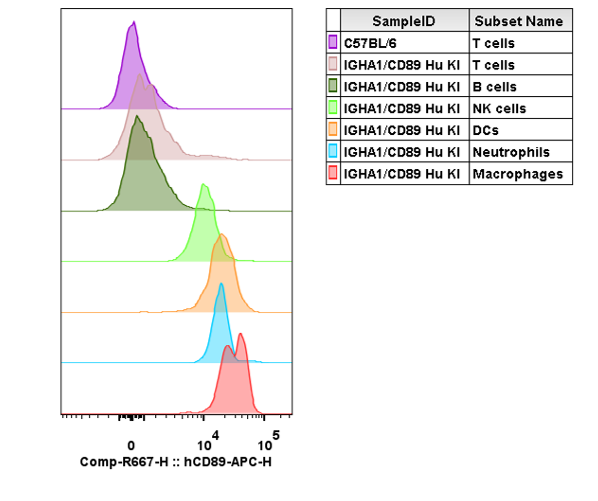
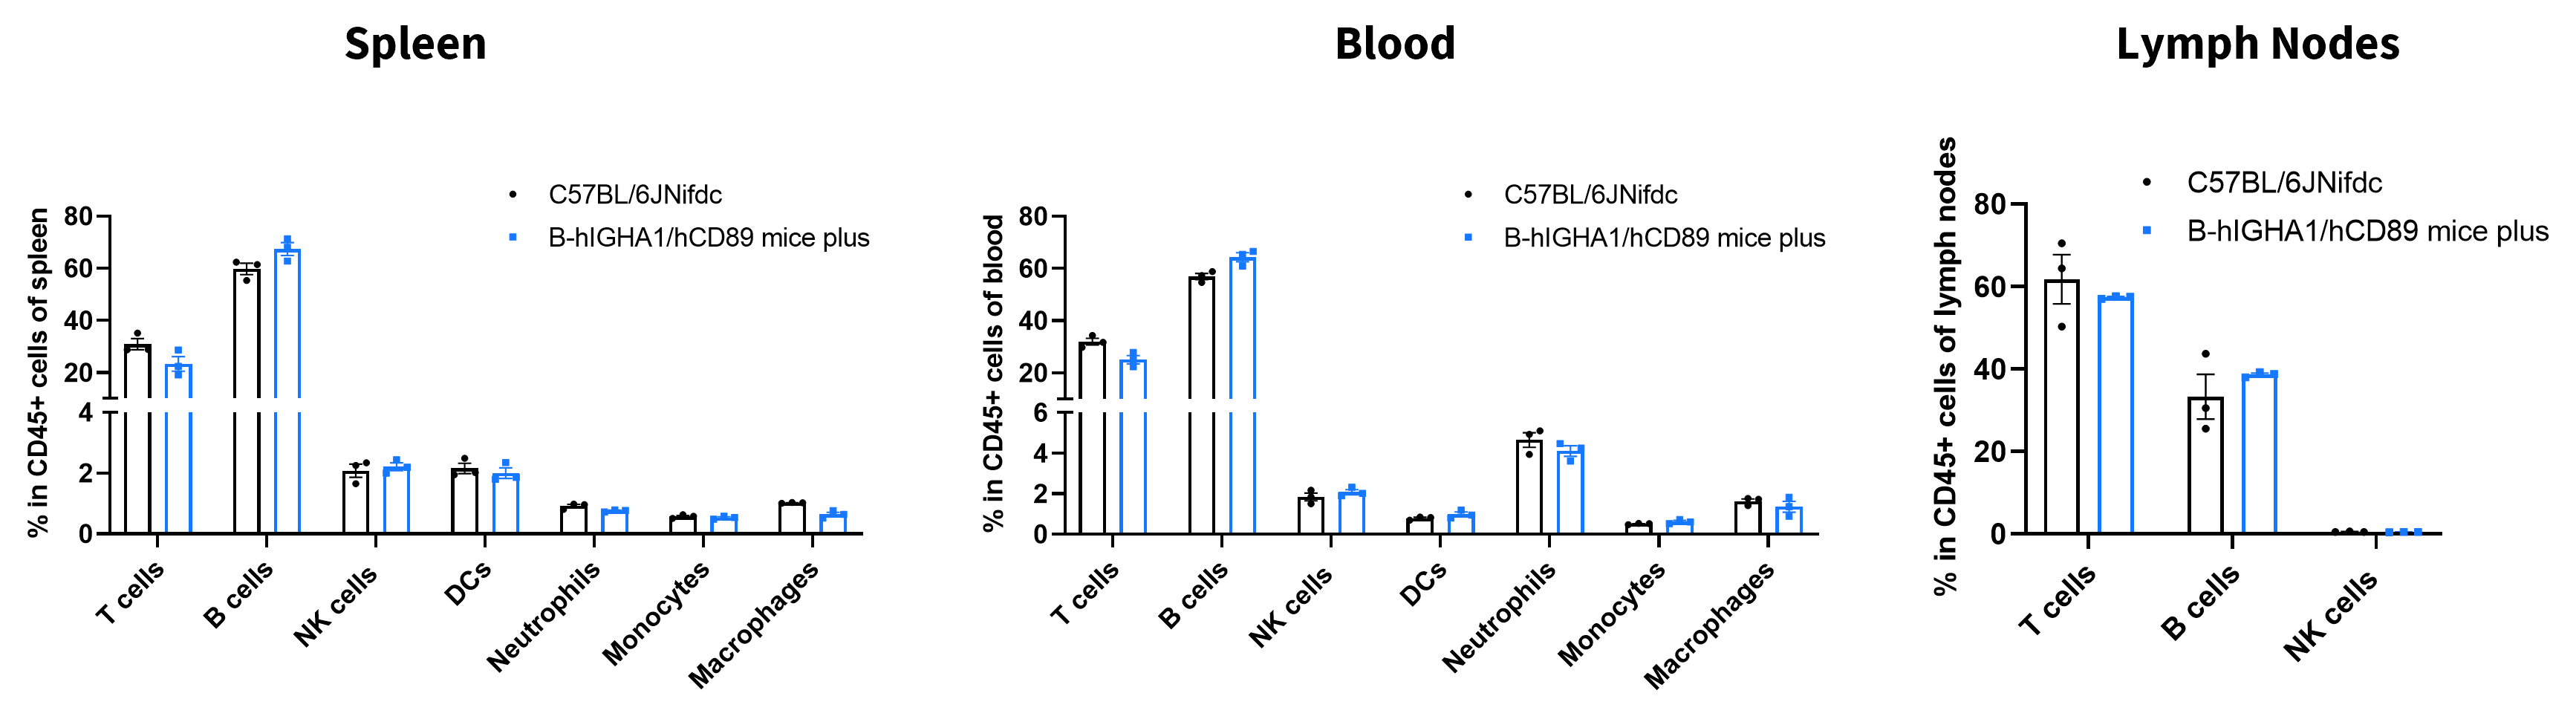
Analysis of Leukocyte Subpopulations
- The percentages of T cells, B cells, NK cells, DCs, neutrophils, monocytes, and macrophages in homozygous B-hIGHA1/hCD89 mice plus were similar to those in C57BL/6JNifdc mice.
Analysis of leukocyte subpopulations by flow cytometry in immune organs and blood. Splenocytes, peripheral blood, and lymph nodes were isolated from C57BL/6JNifdc mice and B-hIGHA1/hCD89 mice plus (female, 9-week-old, n = 3). Single live cells were gated on the CD45⁺ population and analyzed by flow cytometry as indicated. Values are expressed as mean ± SEM.
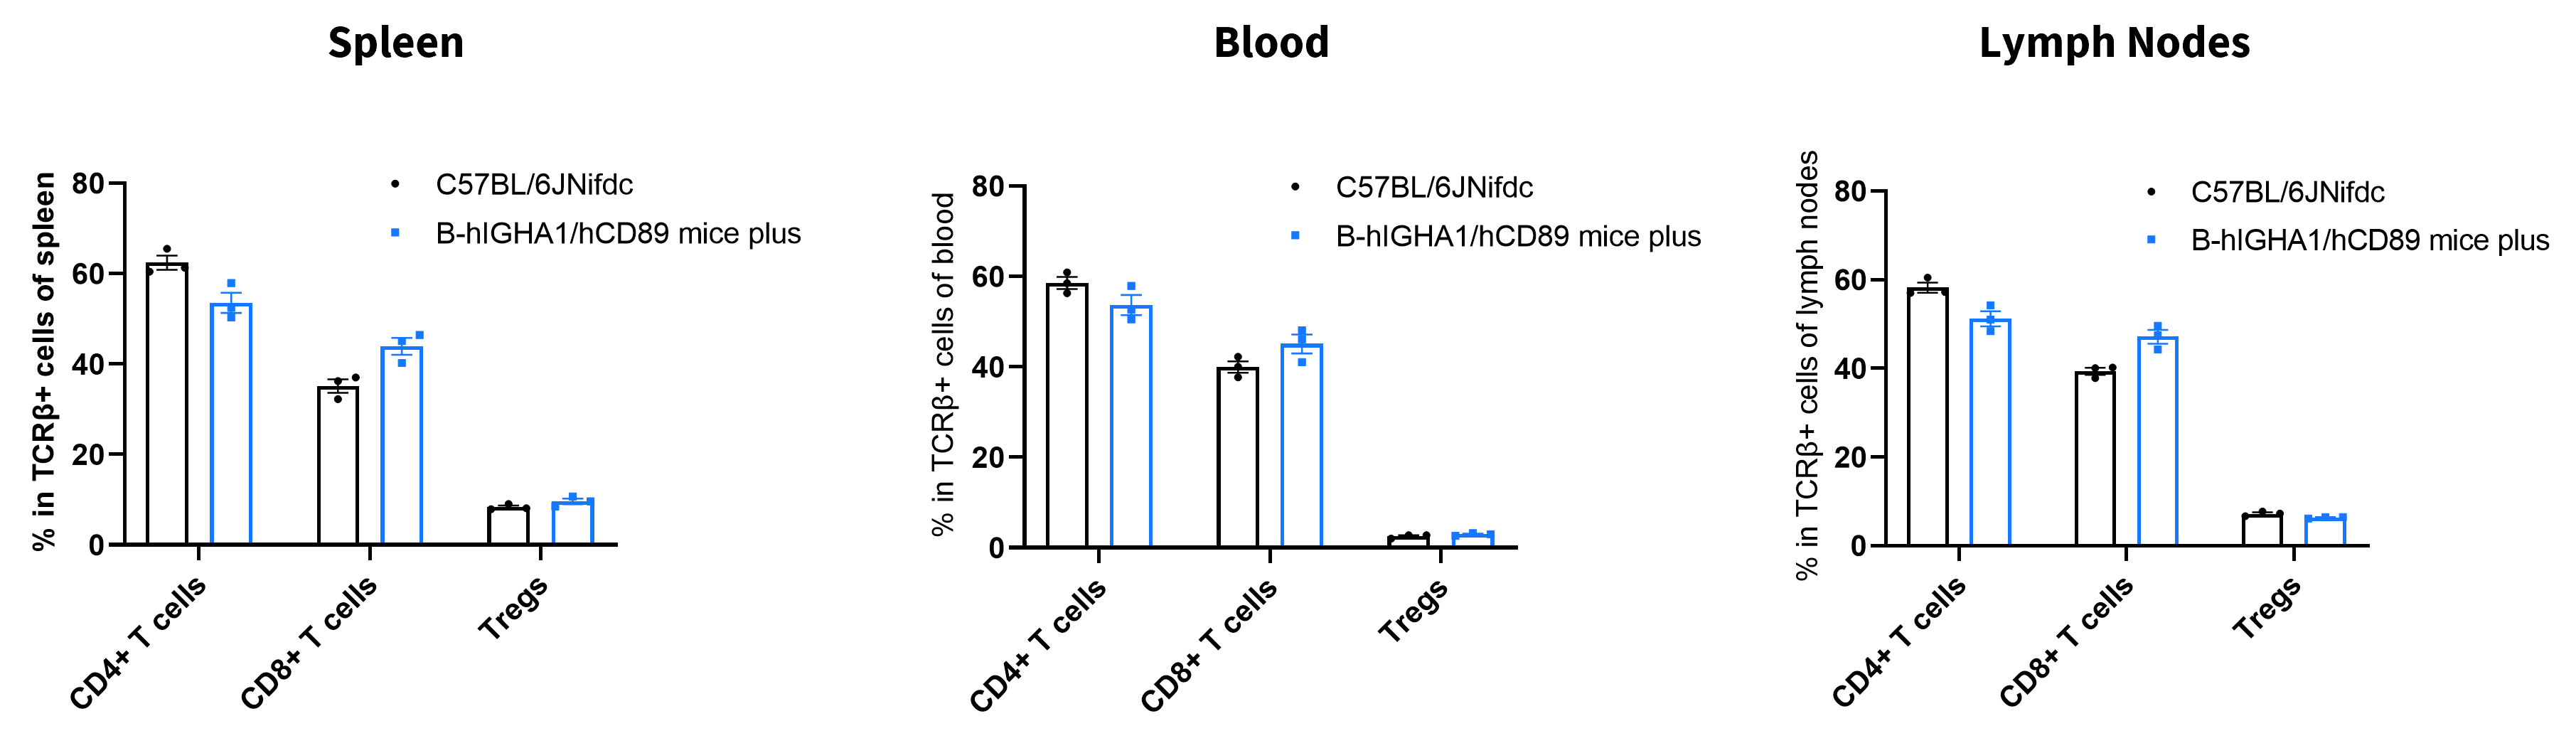
Analysis of T Cell Subpopulations
- The proportions of CD4⁺ T cells, CD8⁺ T cells, and Tregs in homozygous B-hIGHA1/hCD89 mice plus were comparable to those in C57BL/6JNifdc mice.
Analysis of T-cell subpopulations by flow cytometry in immune organs and blood. Splenocytes, peripheral blood, and lymph nodes were isolated from C57BL/6JNifdc mice and B-hIGHA1/hCD89 mice plus (female, 9-week-old, n = 3). Single live cells were gated on the CD3⁺ T-cell population and analyzed by flow cytometry as indicated. Values are expressed as mean ± SEM.
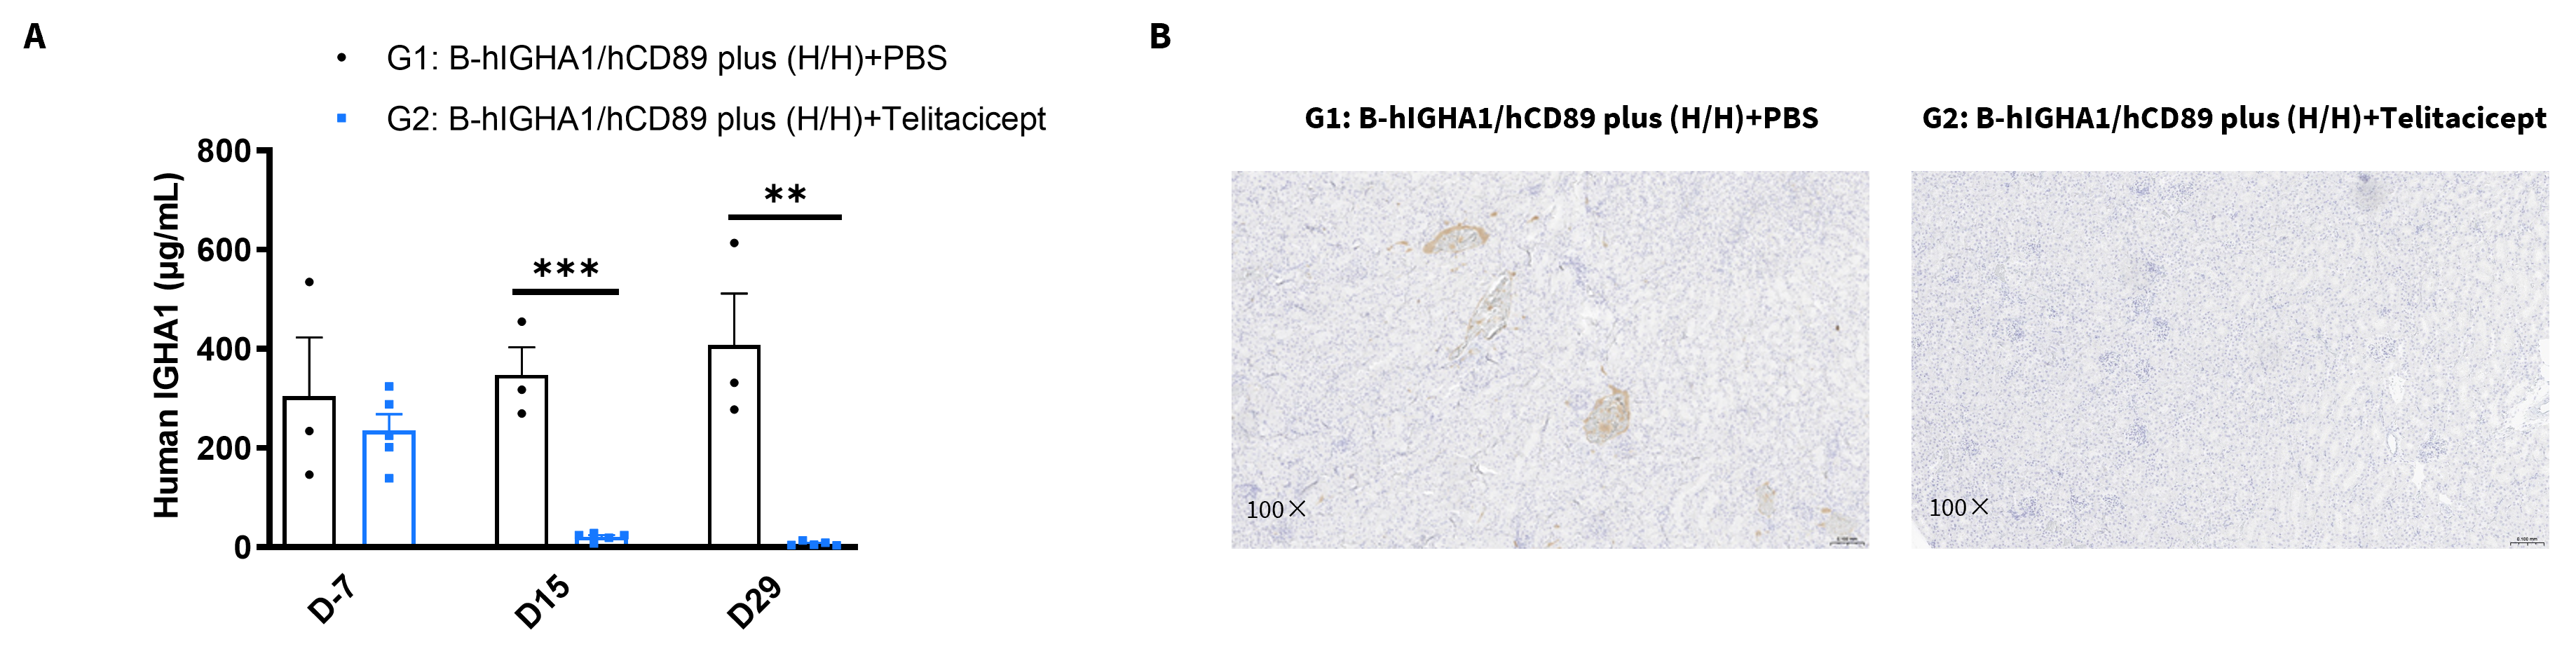
In Vivo Efficacy of Telitacicept
The inhibitory efficiency of the Telitacicept against human IGHA1 in B-hIGHA1/hCD89 mice plus. B-hIGHA1/hCD89 mice plus were randomly divided into two groups (G1: n=3, 10 weeks old, female; G2: n=5, 10 weeks old, female). Telitacicept (commercial) and PBS were administered to the mice individually every other day, total of 14 injections.
- (A) The human IGHA1 protein expression levels were detected in serum on days -7, 15 and 29. The human IGHA1 levels in the treatment group (G2) were reduced compared to the control group (G1).
- (B) IHC assay of kidney samples showed significant IgA deposition in the vessel walls of the control group (G1), while no IgA deposition was found in in the treatment group (G2).
The inhibitory efficiency of the Telitacicept against human IGHA1 in B-hIGHA1/hCD89 mice plus. B-hIGHA1/hCD89 mice plus were randomly divided into two groups (G1: n=3, 10 weeks old, female; G2: n=5, 10 weeks old, female). Telitacicept (commercial) and PBS were administered to the mice individually every other day, total of 14 injections. Values are expressed as mean ± SEM, *P<0.05, **P<0.01, ***P<0.001.
* When publishing results obtained using this animal model, please acknowledge the source as follows: The animal model [B-hIGHA1/hCD89 mice plus] (Cat# 113155) was purchased from Biocytogen.