

C57BL/6-Tnfsf15tm2(TNFSF15)Bcgen Il23atm1(IL23A)Bcgen Il12btm1(IL12B)Bcgen Rag2tm1Bcgen/Bcgen • 114014

TL1A: A key inflammation cytokine in chronic intestinal inflammation and fibrosis-related diseases
IL23: A key inflammation cytokine in the inflammatory response driven by Th17 cells
RAG2: An essential chromatin-sensing cofactor in V(D)J recombination

TL1A
IL23A
IL12B
Rag2


Soluble TL1A expression analysis in B-hTL1A/hIL23A/hIL12B, Rag2 KO mice by ELISA. Bone marrow derived dendritic cells (BMDCs) were produced by culturing the bone marrow from wild-type C57BL/6JNifdc mice (+/+) and homozygous B-hTL1A/hIL23A/hIL12B, Rag2 KO mice (H/H;H/H;H/H;-/-), which were stimulated with LPS in vitro. After stimulation, the supernatants were collected and the levels of soluble TL1A were measured using the species-specific human TL1A ELISA kit. Soluble human TL1A was exclusively detectable in homozygous B-hTL1A/hIL23A/hIL12B, Rag2 KO mice but not wild-type C57BL/6JNifdc mice. Values are expressed as mean ± SEM. ND: not detectable.

Mouse IL-23 and human IL-23 expression analysis in B-hTL1A/hIL23A/hIL12B, Rag2 KO mice by ELISA. Bone marrow derived dendritic cells were produced by culturing the bone marrow from wild-type C57BL/6JNifdc mice (+/+), and homozygous B-hTL1A/hIL23A/hIL12B, Rag2 KO mice (H/H;H/H;H/H;-/-), which were stimulated with LPS in vitro. After stimulation, the supernatants were collected and the levels of mouse and human IL23 were analyzed by ELISA(R&D, M2300; R&D, D2300B). Mouse IL23 was only detectable in wild-type C57BL/6JNifdc mice. Human IL23 was exclusively detectable in homozygous B-hTL1A/hIL23A/hIL12B, Rag2 KO mice. Values are expressed as mean ± SEM. ND: not detectable.
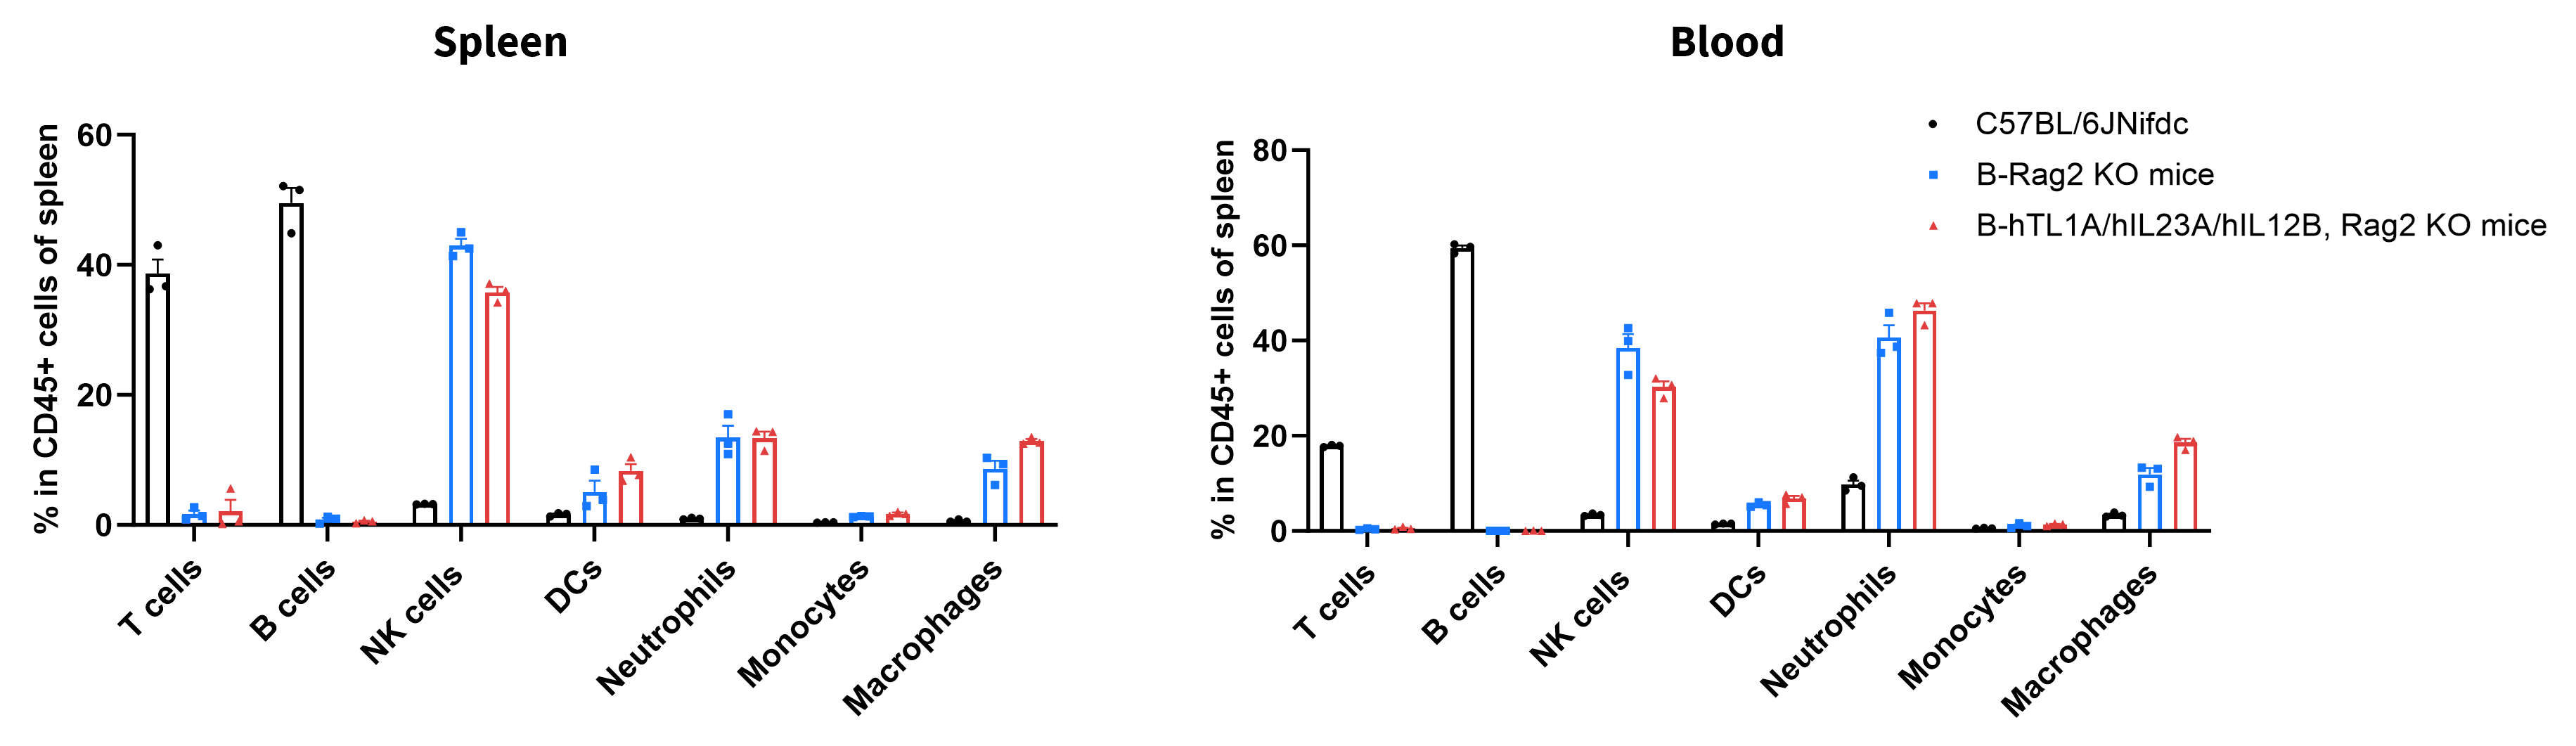
Analysis of leukocyte subpopulations by flow cytometry in immune organs and blood. Splenocytes and peripheral blood were isolated from wild-type C57BL/6JNifdc mice, B-Rag2 KO mice, and B-hTL1A/hIL23A/hIL12B, Rag2 KO mice (female, n=3, 8-week-old). Single live cells were gated on the CD45⁺ population and analyzed by flow cytometry as indicated. Values are expressed as mean ± SEM.
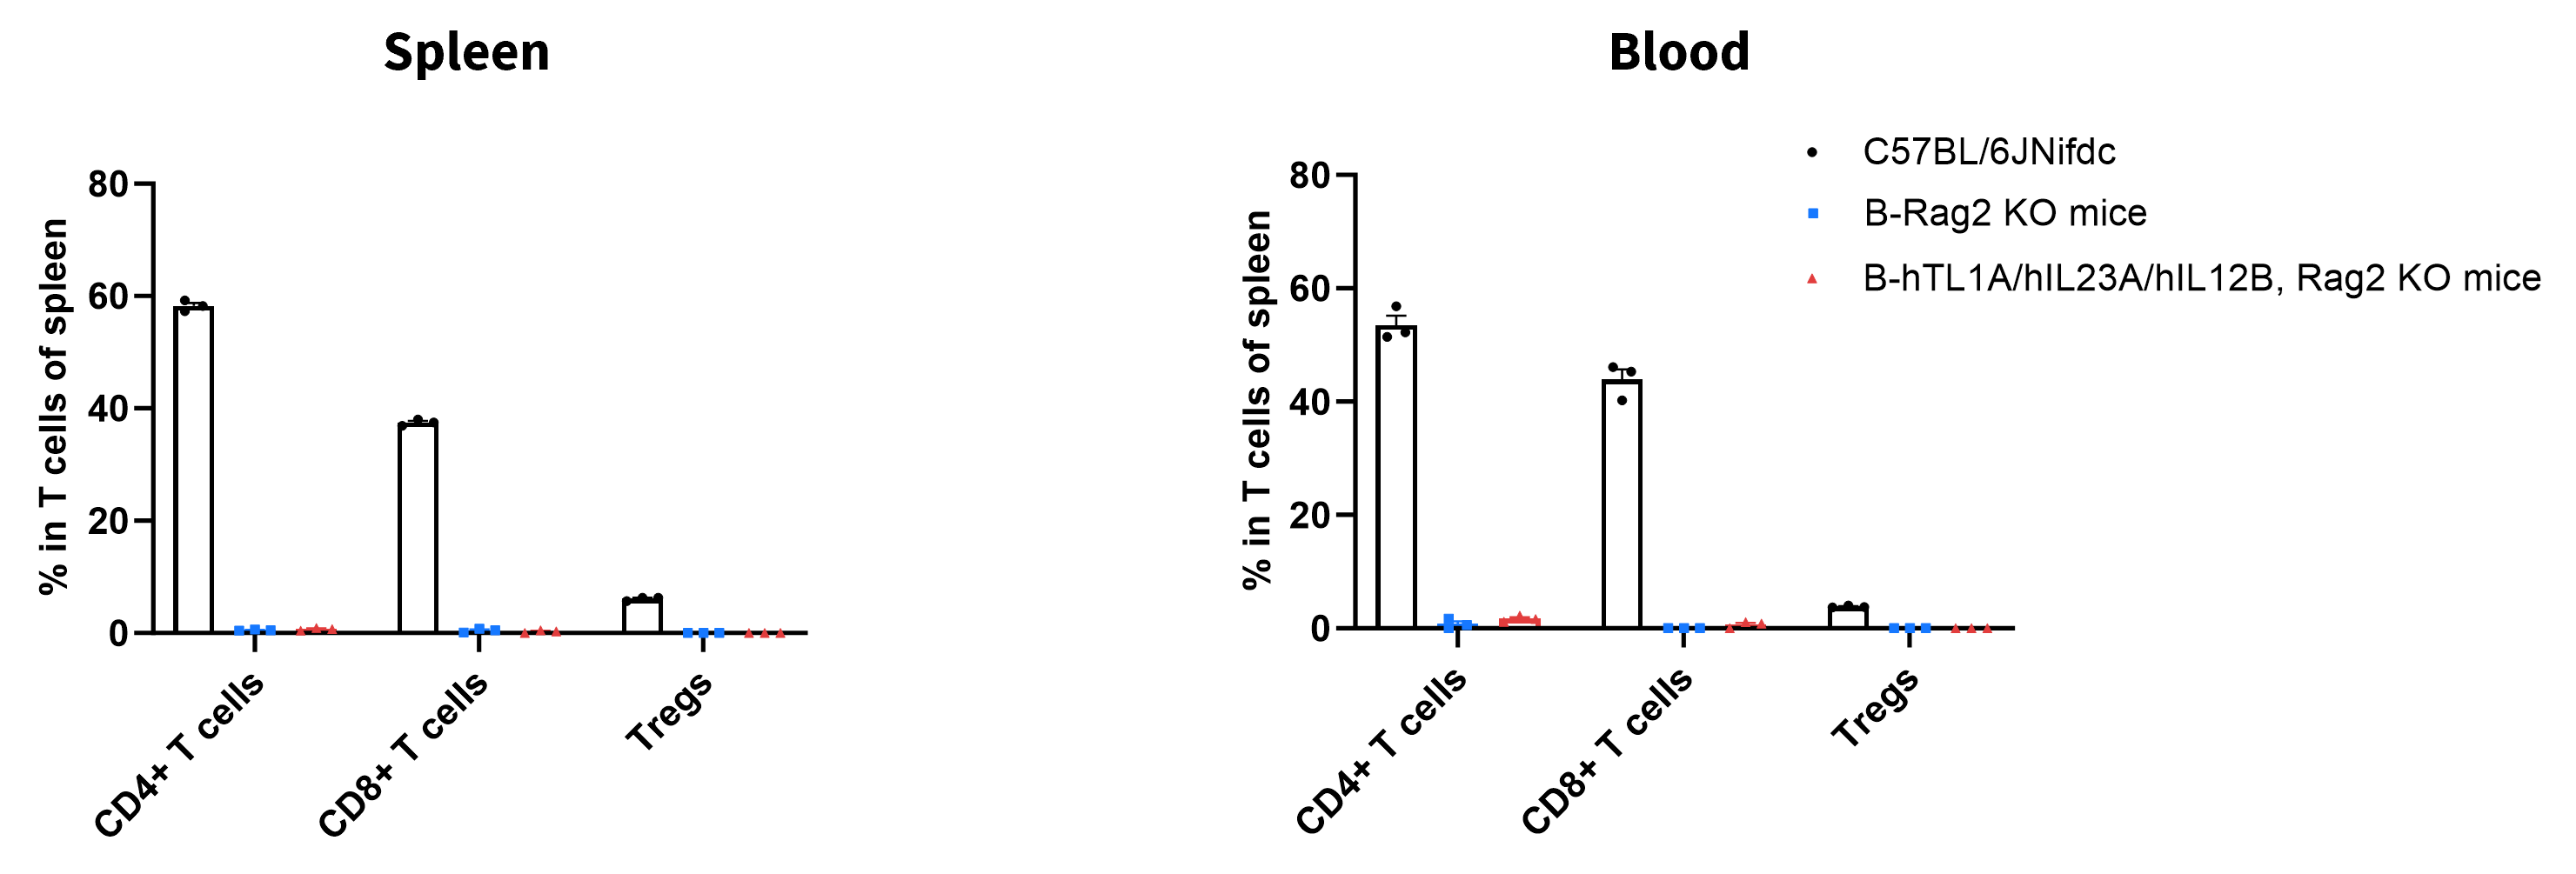
Analysis of T-cell subpopulations by flow cytometry in immune organs and blood. Splenocytes and peripheral blood were isolated from wild-type C57BL/6JNifdc mice, B-Rag2 KO mice, and B-hTL1A/hIL23A/hIL12B, Rag2 KO mice (female, n=3, 8-week-old). Single live cells were gated on the CD3⁺ T-cell population and analyzed by flow cytometry as indicated. Values are expressed as mean ± SEM.

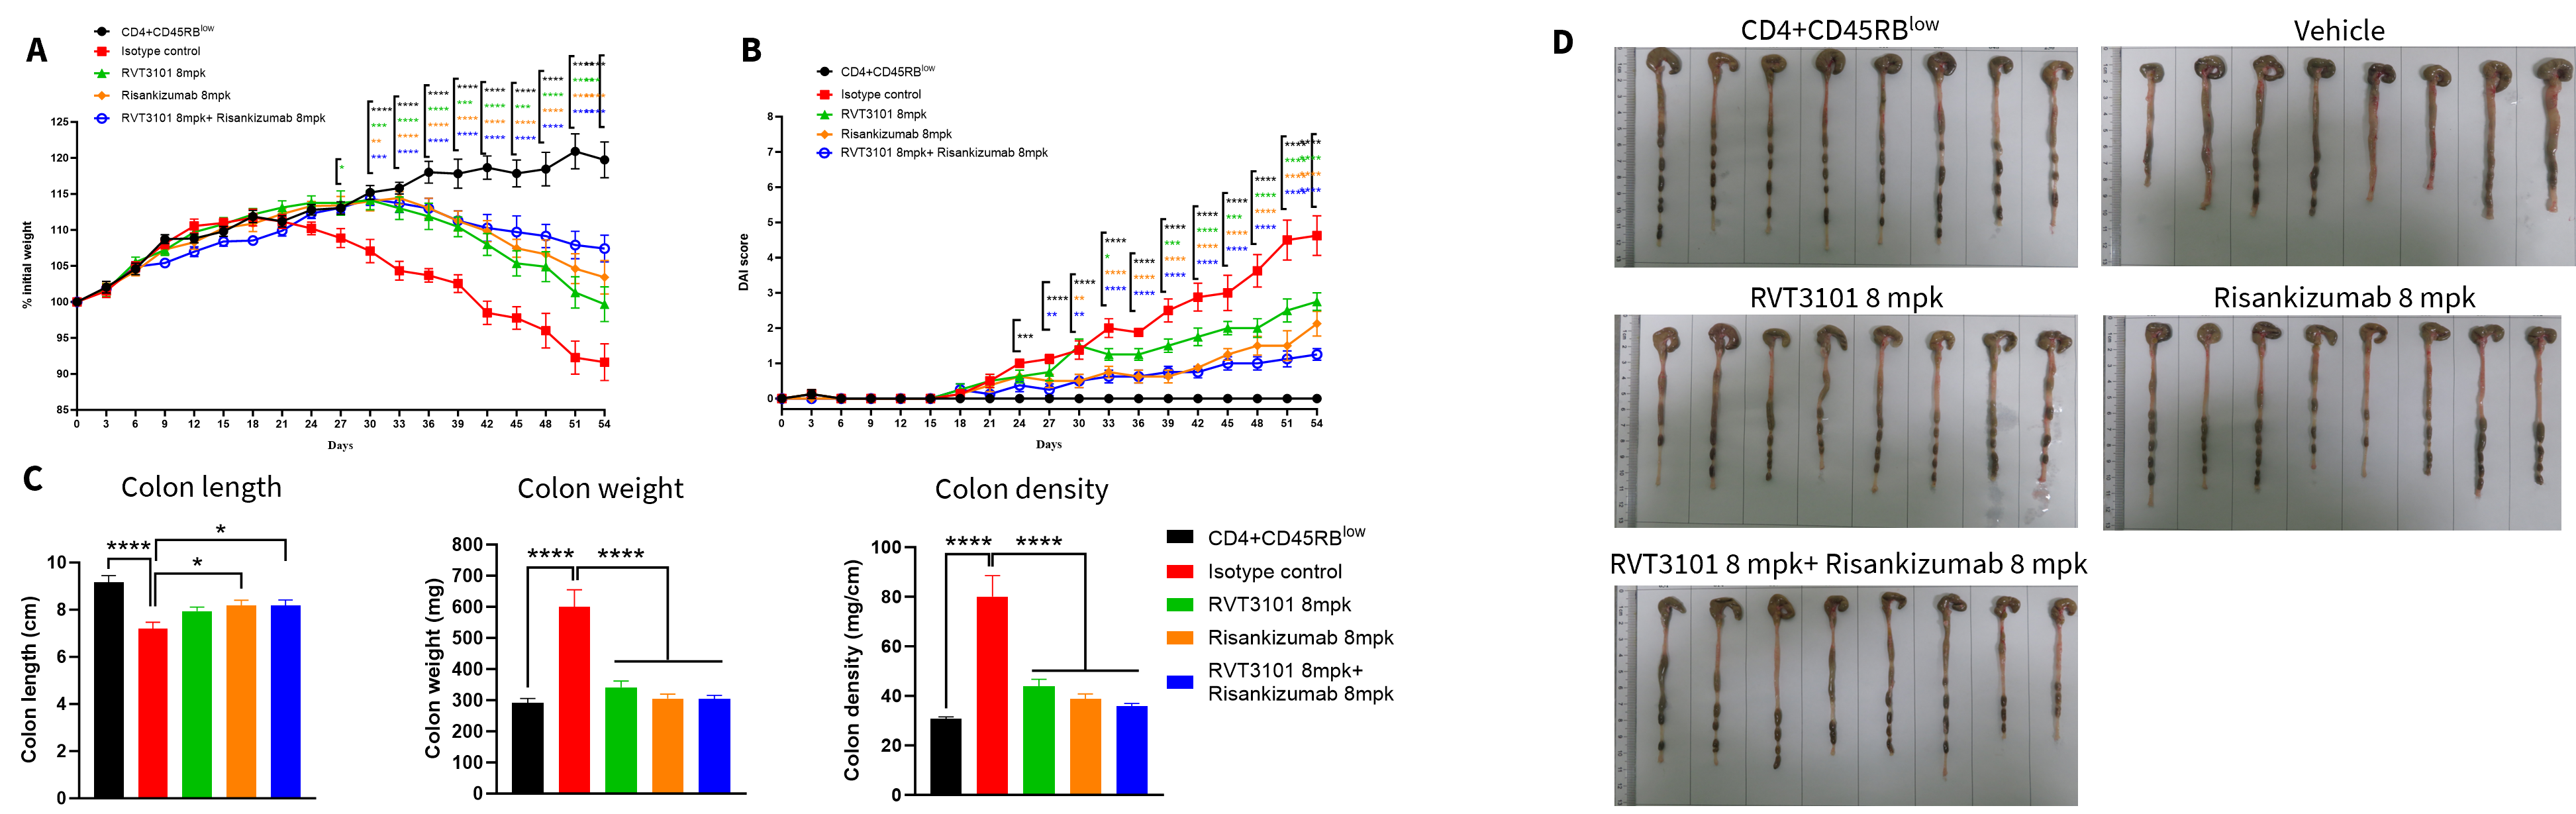
The therapeutic efficacy of RVT3101 and Risankizumab on T cells transfer induced colitis model in B-hTL1A/hIL23A/hIL12B, Rag2 KO mice. CD4+CD45RBlow T and CD4+CD45RBhigh T cells were isolated from the spleen of B-hIL23A/hIL12B/hIL23R/hIL12RB1 plus mice. B-hTL1A/hIL23A/hIL12B, Rag2 KO mice in group G1 were injected with CD4+CD45RBlow T cells, while B-hTL1A/hIL23A/hIL12B, Rag2 KO mice in groups G2-G5 were injected with CD4+CD45RBhigh T cells. The treatment groups received anti-TL1A antibody RVT3101 (8 mpk, provided by WuXi AppTec), anti-human IL23p19 antibody Risankizumab (8 mpk, providedby WuXi AppTec) alone or in combination every three days. (A) Body weight change. (B) DAI score. (C) Colon index. (D) Colon photo. Two-way ANOVA or one-way ANOVA was used for multiple comparisons, with each group compared to Vehicle. Values are expressed as mean ± SEM. *p<0.05, **p<0.01, ***p<0.001, ****p<0.0001. Note: This experiment was conducted by WuXi AppTec, T cell transfer induced chronic colitis in B-hTL1A/hIL23A/hIL12B, Rag2 KO mice (Donor: B-hIL23A/hIL12B/hIL23R/hIL12RB1 plus mice).
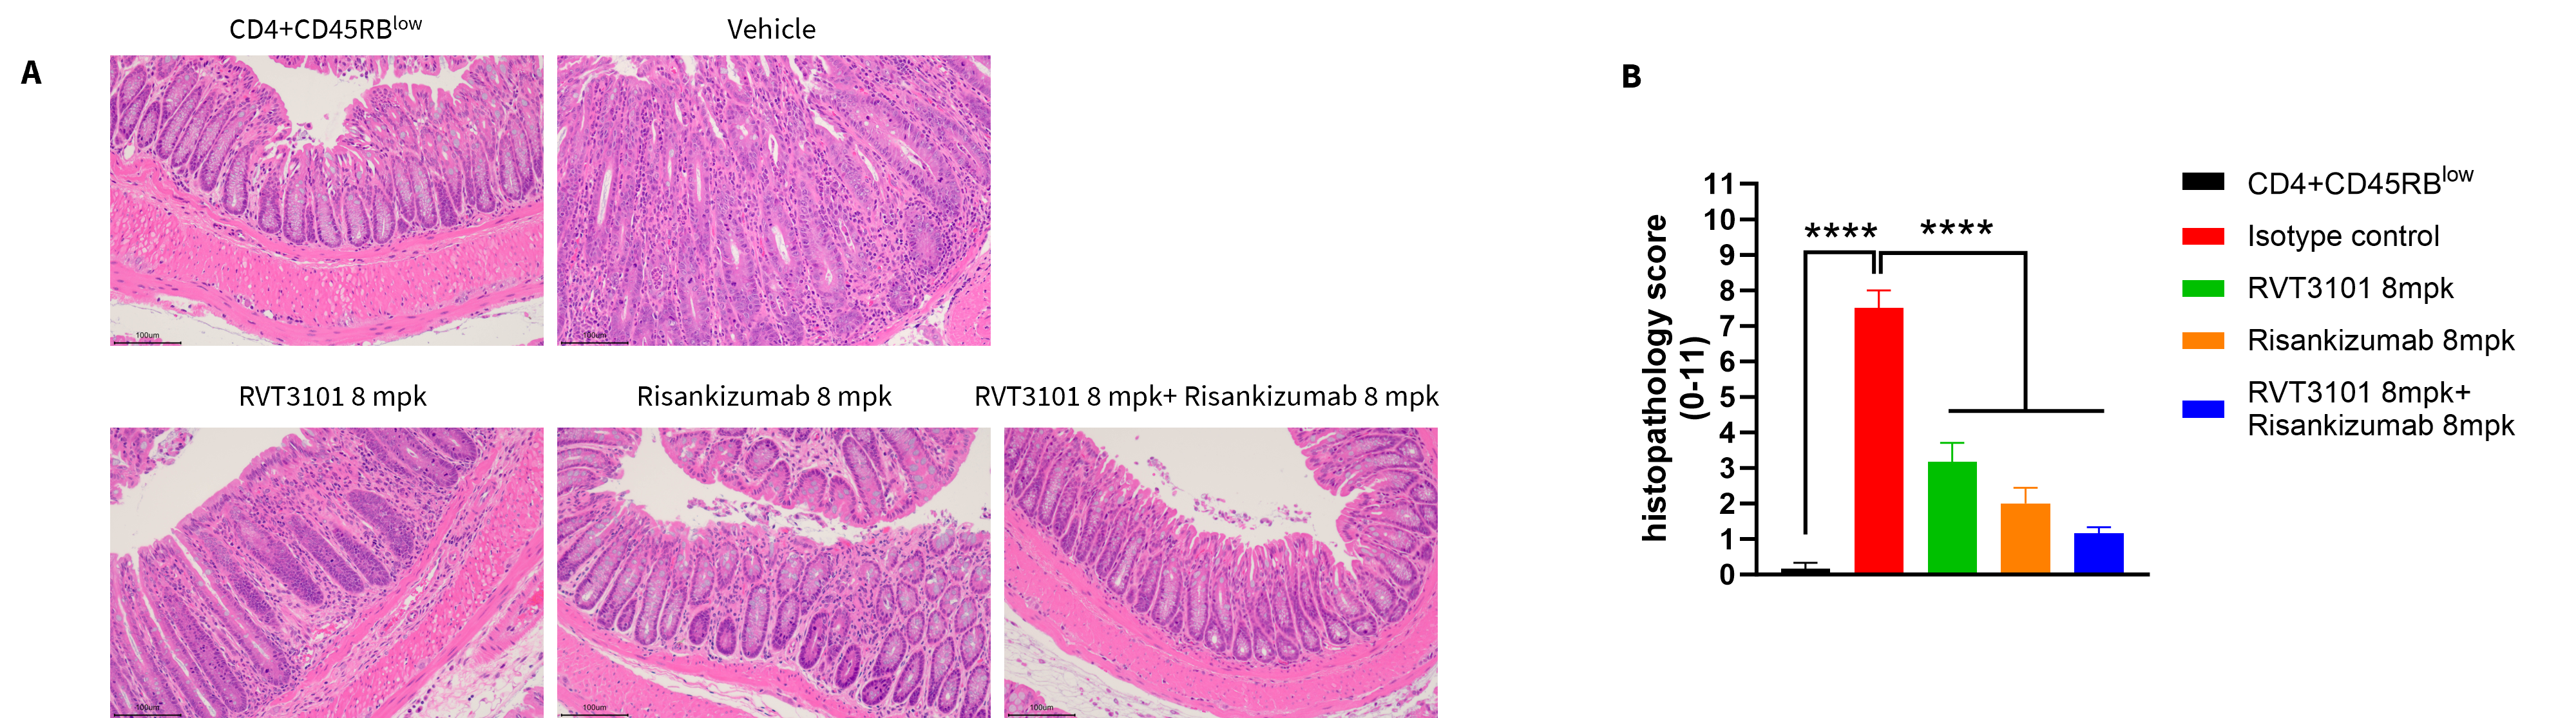
The therapeutic efficacy of RVT3101 and Risankizumab on T cells transfer induced colitis model in B-hTL1A/hIL23A/hIL12B, Rag2 KO mice. CD4+CD45RBlow T and CD4+CD45RBhigh T cells were isolated from the spleen of B-hIL23A/hIL12B/hIL23R/hIL12RB1 plus mice. B-hTL1A/hIL23A/hIL12B, Rag2 KO mice in group G1 were injected with CD4+CD45RBlow T cells, while B-hTL1A/hIL23A/hIL12B, Rag2 KO mice in groups G2-G5 were injected with CD4+CD45RBhigh T cells. The treatment groups received anti-TL1A antibody RVT3101 (8 mpk, provided by WuXi AppTec), anti-human IL23p19 antibody Risankizumab (8 mpk, providedby WuXi AppTec) alone or in combination every three days. (A) H&E staining of colon tissue. (B) Pathological score. Two-way ANOVA or one-way ANOVA was used for multiple comparisons, with each group compared to Vehicle. Values are expressed as mean ± SEM. *p<0.05, **p<0.01, ***p<0.001, ****p<0.0001. Note: This experiment was conducted by WuXi AppTec, T cell transfer induced chronic colitis in B-hTL1A/hIL23A/hIL12B, Rag2 KO mice (Donor: B-hIL23A/hIL12B/hIL23R/hIL12RB1 plus mice).
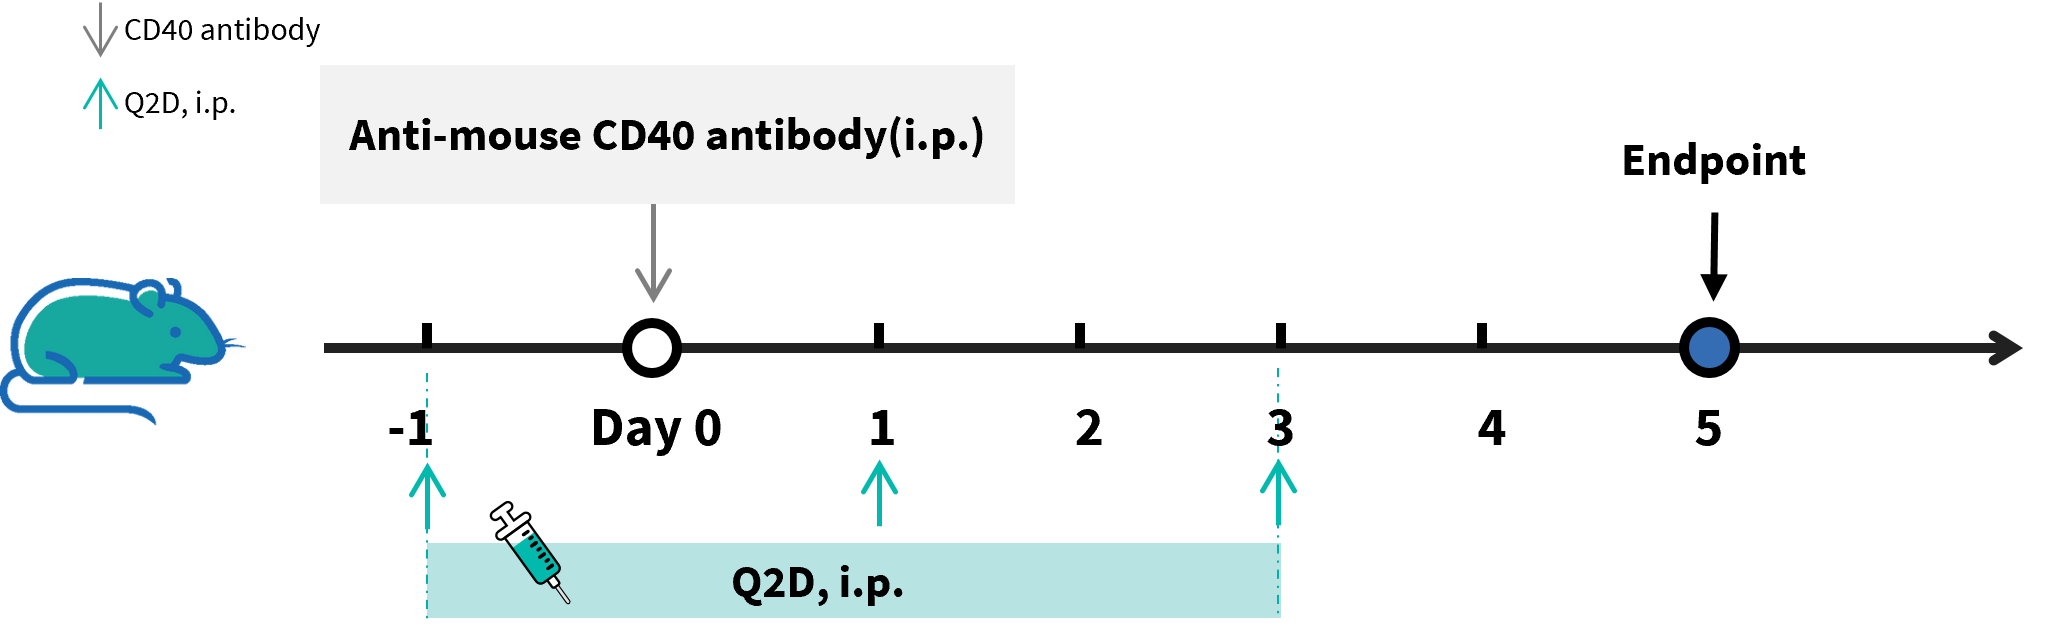
Experimental schedule for anti-mouse CD40 antibody induced colitis and in vivo efficacy of anti-human IL23p19 antibody in B-hTL1A/hIL23A/hIL12B, Rag2 KO mice. B-hTL1A/hIL23A/hIL12B, Rag2 KO mice in group G1 received PBS, and B-hTL1A/hIL23A/hIL12B, Rag2 KO mice in group G2-G3 received anti-mouse CD40 antibody. Animals in group G3 were given 25 mg/kg of anti-human IL23p19 antibody Risankizumab analog (in house) every two days.
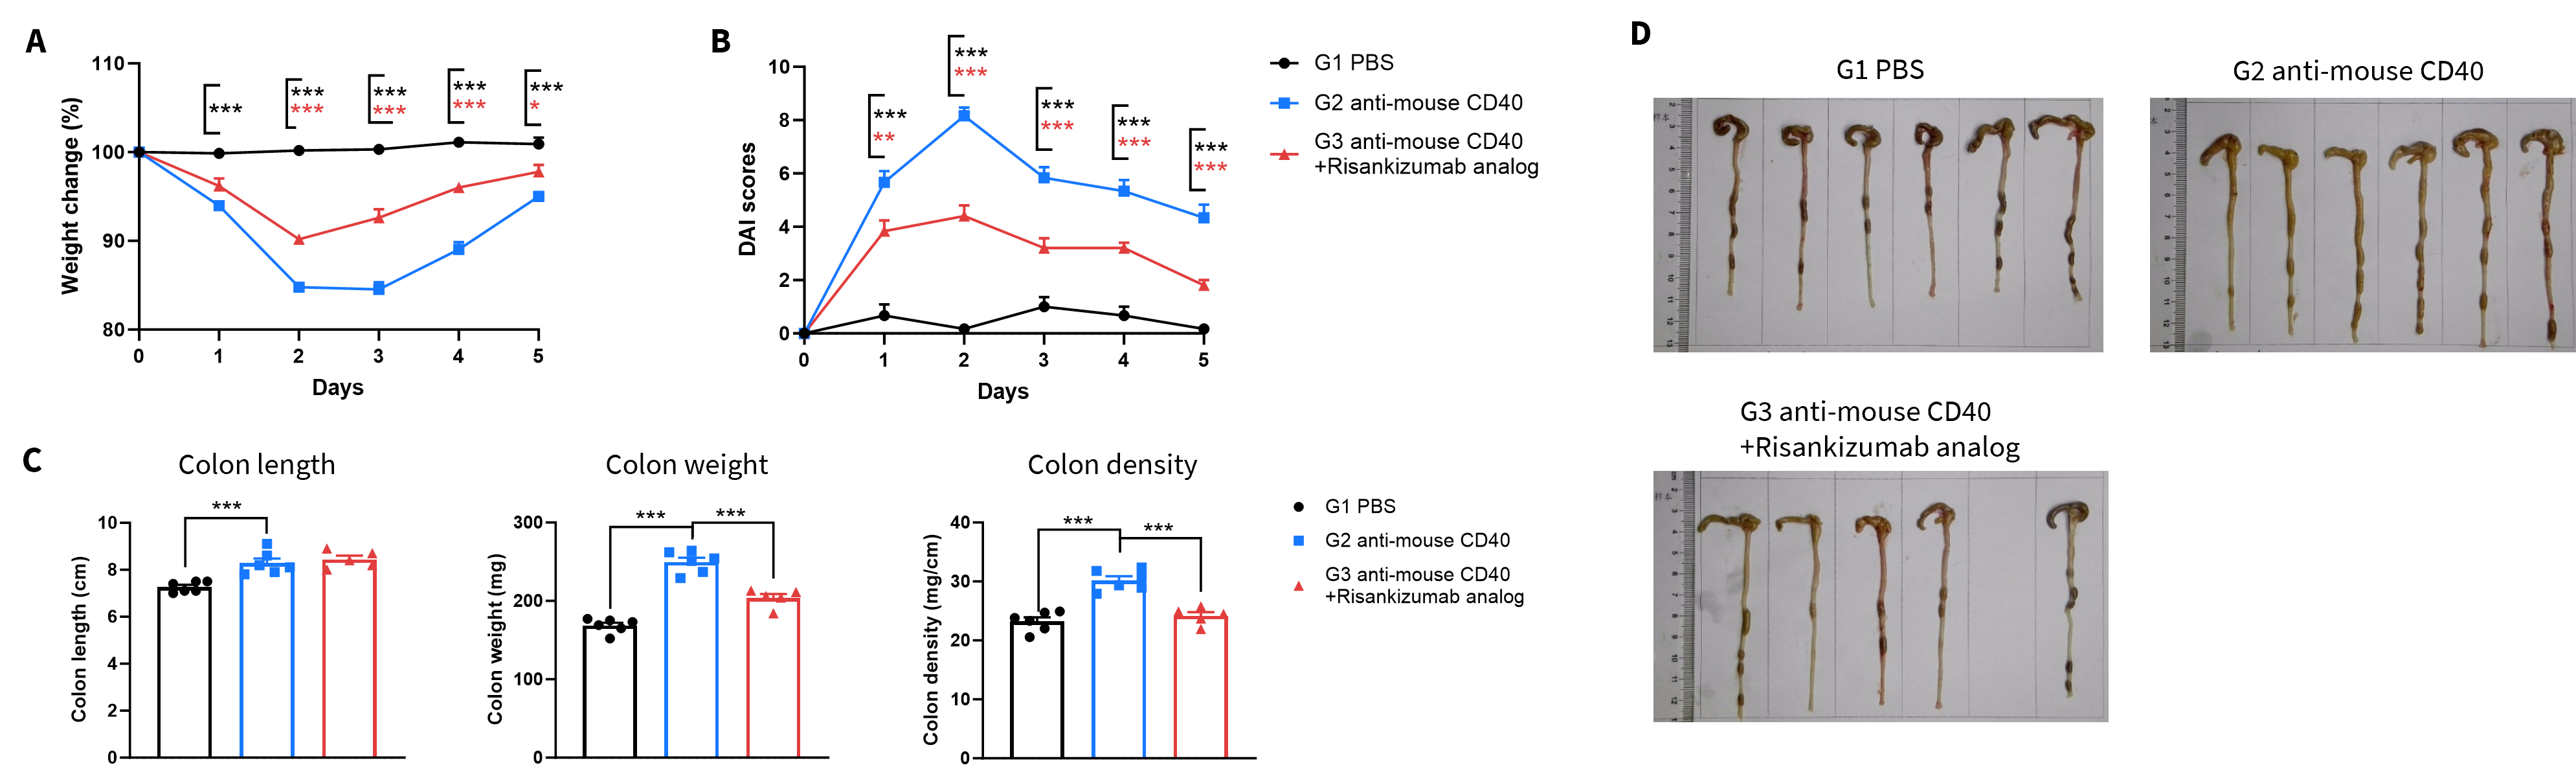
The therapeutic efficacy of anti-human IL23p19 antibody on anti-mouse CD40 antibody induced colitis model in B-hTL1A/hIL23A/hIL12B, Rag2 KO mice. B-hTL1A/hIL23A/hIL12B, Rag2 KO mice in group G1 received PBS, and B-hTL1A/hIL23A/hIL12B, Rag2 KO mice in group G2-G3 received anti-CD40 antibody. Body weight and DAI score were recorded daily. On day 5, the mice were sacrificed, and colon length and weight were recorded. (A) Body weight change. (B) DAI score. (C) Colon Index. (D) Colon photo. Two-way ANOVA or one-way ANOVA was used for multiple comparisons, with each group compared to G2. Values are expressed as mean ± SEM. *p<0.05, **p<0.01, ***p<0.001.
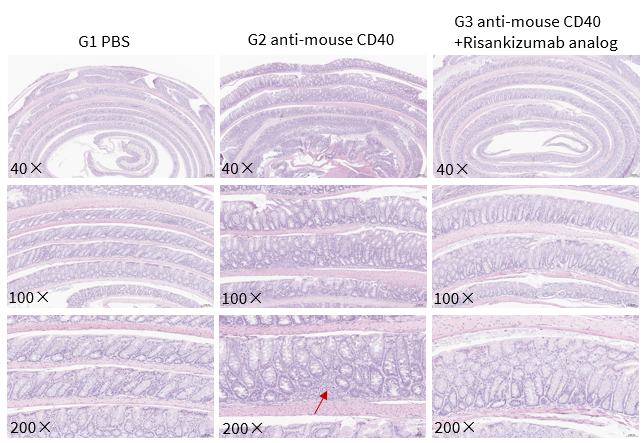
The therapeutic efficacy of anti-human IL23p19 antibody on anti-mouse CD40 antibody induced colitis model in B-hTL1A/hIL23A/hIL12B, Rag2 KO mice. B-hTL1A/hIL23A/hIL12B, Rag2 KO mice in group G1 received PBS, and B-hTL1A/hIL23A/hIL12B, Rag2 KO mice in group G2-G3 received anti-CD40 antibody. On day 5, the mice were sacrificed, colon tissues were collected at the study endpoint and analyzed by H&E staining. The red arrow represented the infiltration of inflammatory cells.
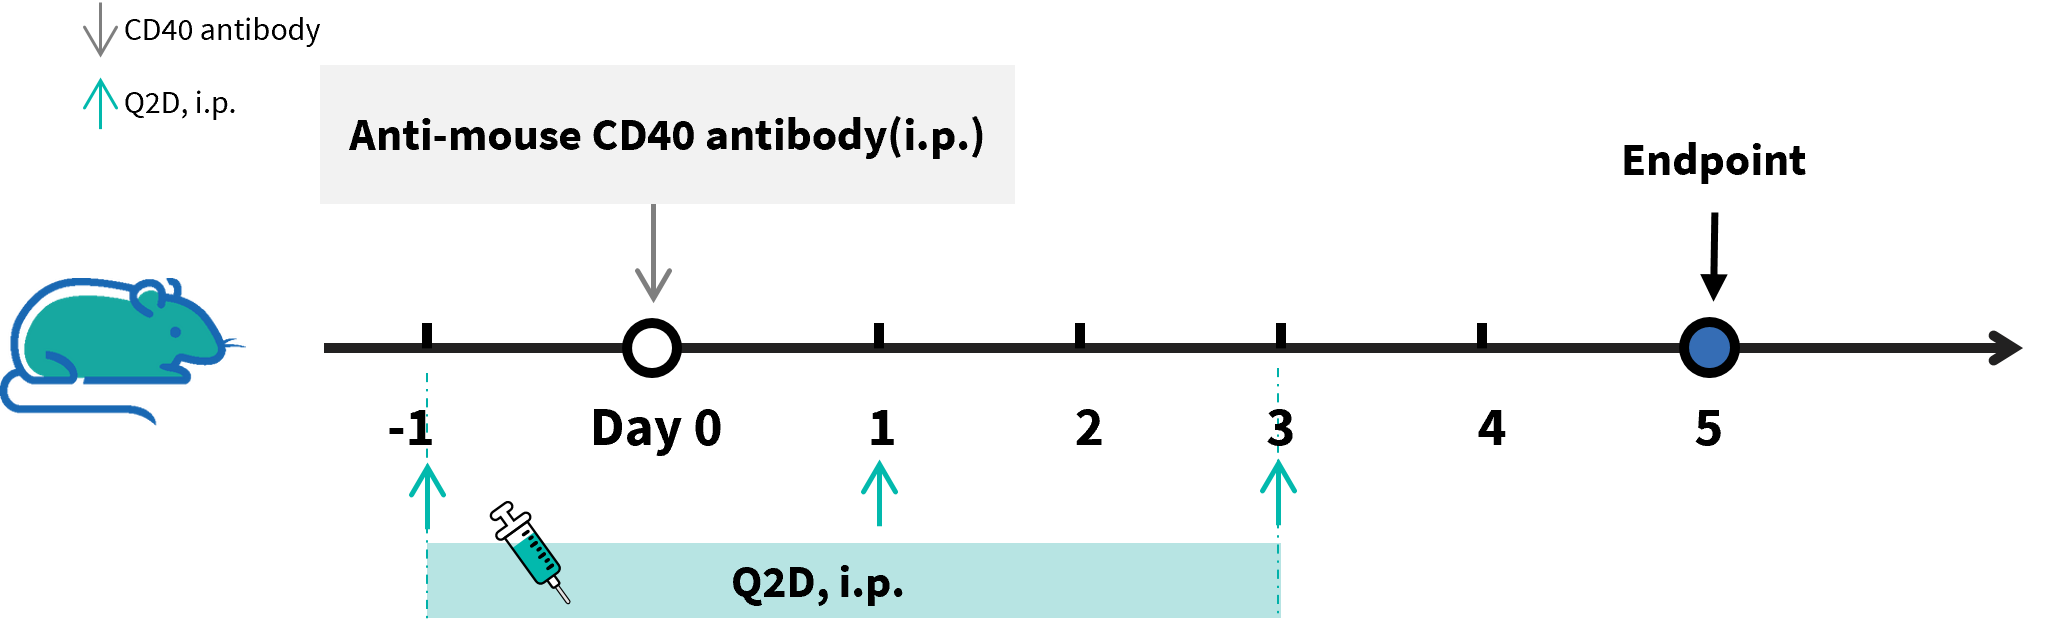
Experimental schedule for anti-mouse CD40 antibody induced colitis and in vivo efficacy of anti-human IL23p40 antibody in B-hTL1A/hIL23A/hIL12B, Rag2 KO mice. B-hTL1A/hIL23A/hIL12B, Rag2 KO mice in group G1 received PBS, and B-hTL1A/hIL23A/hIL12B, Rag2 KO mice in group G2-G3 received anti-mouse CD40 antibody. Animals in group G3 were given 25 mg/kg of anti-human IL23p40 antibody Ustekinumab analog (in house) every two days.
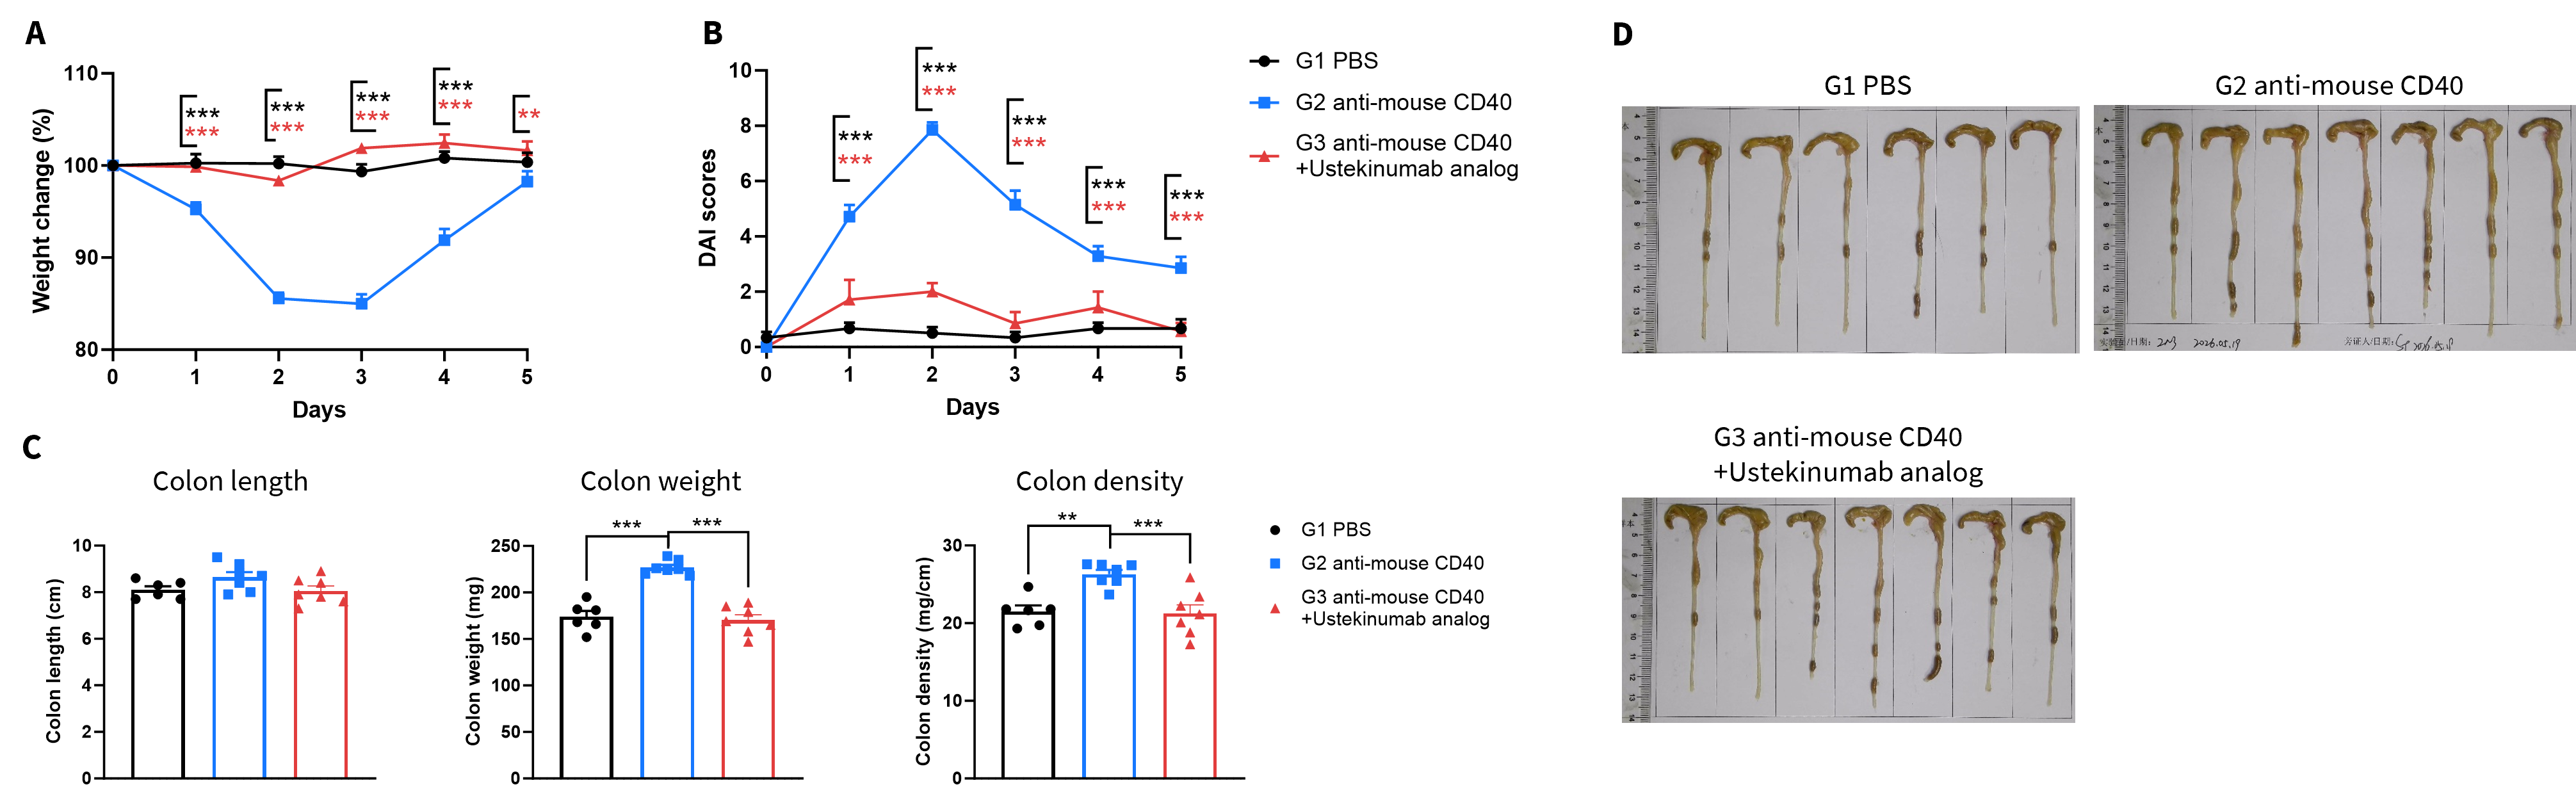
The therapeutic efficacy of anti-human IL23p40 antibody on anti-mouse CD40 antibody induced colitis model in B-hTL1A/hIL23A/hIL12B, Rag2 KO mice. B-hTL1A/hIL23A/hIL12B, Rag2 KO mice in group G1 received PBS, and B-hTL1A/hIL23A/hIL12B, Rag2 KO mice in group G2-G3 received anti-CD40 antibody. Body weight and DAI score were recorded daily. On day 5, the mice were sacrificed, and colon length and weight were recorded. (A) Body weight change. (B) DAI score. (C) Colon Index. (D) Colon photo. Two-way ANOVA or one-way ANOVA was used for multiple comparisons, with each group compared to G2. Values are expressed as mean ± SEM. *p<0.05, **p<0.01, ***p<0.001.
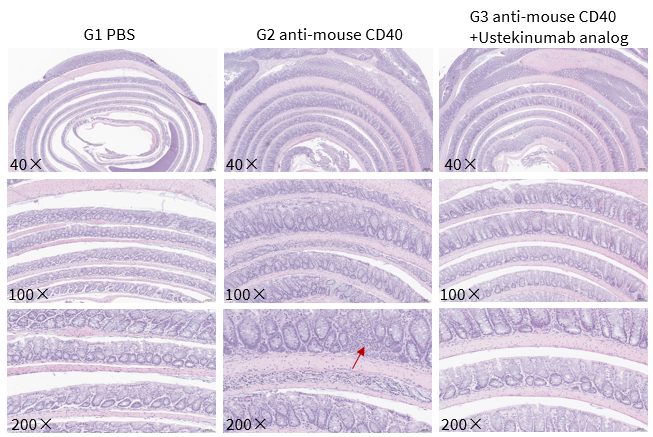
The therapeutic efficacy of anti-human IL23p40 antibody on anti-mouse CD40 antibody induced colitis model in B-hTL1A/hIL23A/hIL12B, Rag2 KO mice. B-hTL1A/hIL23A/hIL12B, Rag2 KO mice in group G1 received PBS, and B-hTL1A/hIL23A/hIL12B, Rag2 KO mice in group G2-G3 received anti-CD40 antibody. On day 5, the mice were sacrificed, colon tissues were collected at the study endpoint and analyzed by H&E staining. The red arrow represented the infiltration of inflammatory cells.
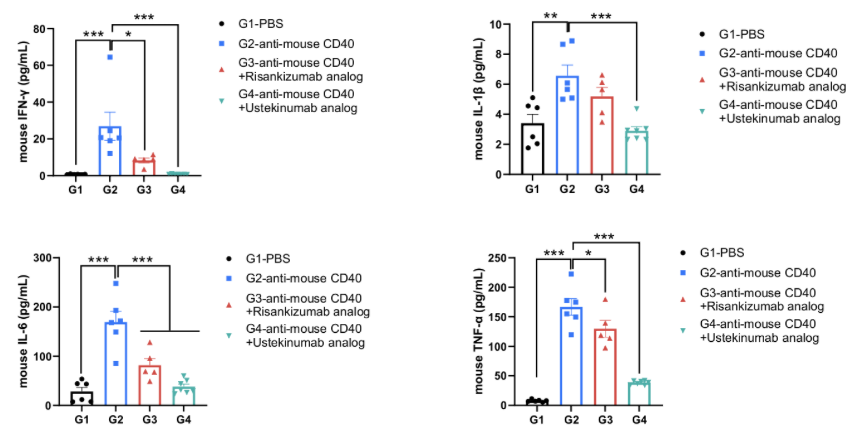
The therapeutic efficacy of anti-human IL23p19 antibody and anti-human IL23p40 antibody on anti-mouse CD40 antibody induced colitis model in B-hTL1A/hIL23A/hIL12B, Rag2 KO mice. B-hTL1A/hIL23A/hIL12B, Rag2 KO mice in group G1 received PBS, and B-hTL1A/hIL23A/hIL12B, Rag2 KO mice in group G2-G4 received anti-CD40 antibody. Animals in group G3 were given 25 mg/kg of anti-human IL23p19 antibody Risankizumab analog (in house) every two days, animals in group G4 were given 25 mg/kg of anti-human IL23p40 antibody Ustekinumab analog (in house) every two days. On day 5, the mice were sacrificed, serum were collected for protein analysis of pro-inflammatory factors mouse IFN-γ, IL-1β, IL-6, and TNF-α. One-way ANOVA was used for multiple comparisons, with each group compared to G2. Values are expressed as mean ± SEM. *p<0.05, **p<0.01, ***p<0.001.