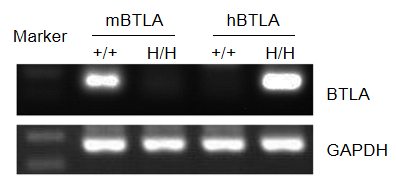
mRNA expression analysis
Strain specific analysis of BTLA gene expression in WT and hBTLA mice by RT-PCR. Mouse Btla mRNA was detectable only in splenocytes of wild-type (+/+) mice. Human BTLA mRNA was detectable only in H/H, but not in +/+ mice.
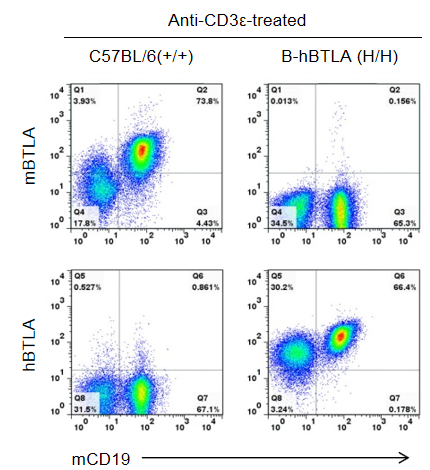
Protein expression analysis in T cells
Strain specific BTLA expression analysis in homozygous B-hBTLA mice by flow cytometry. Splenocytes were collected from WT and homozygous B-hBTLA (H/H) mice stimulated with anti-CD3ε in vivo, and analyzed by flow cytometry with species-specific anti-BTLA antibody. Mouse BTLA was detectable in WT mice. Human BTLA was exclusively detectable in homozygous B-hBTLA but not WT mice.
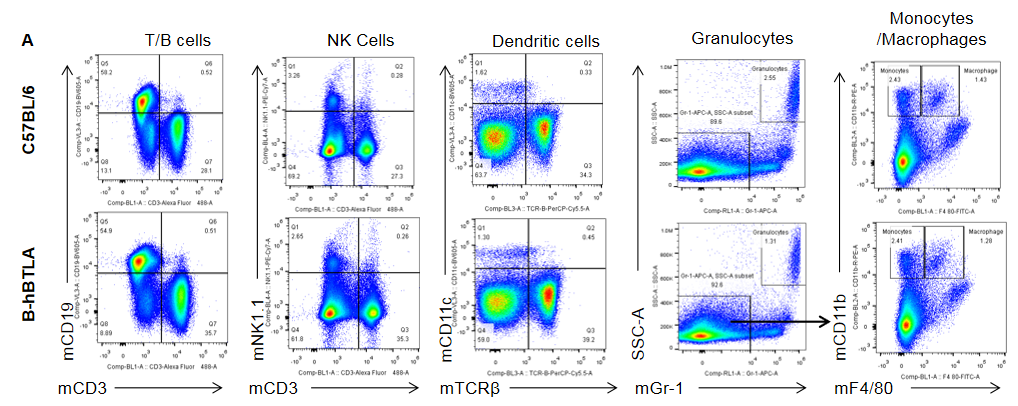
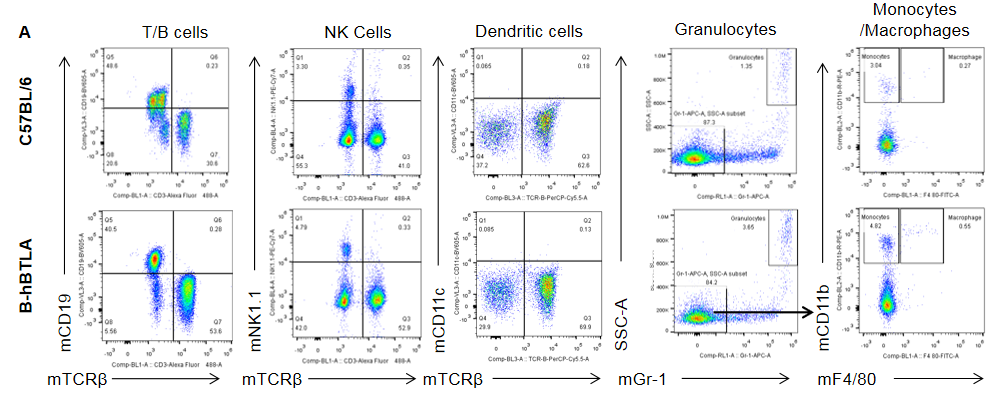
Analysis of splenic leukocyte subpopulations in B-hBTLA mice
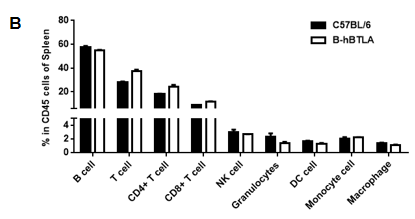
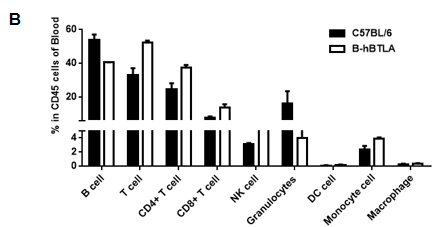
Analysis of splenic leukocyte subpopulations by FACS. Splenocytes were isolated from female C57BL/6 and B-hBTLA mice (n=3, 6 weeks-old) and analyzed by flow cytometry to assess leukocyte subpopulations. (A) Representative FACS plots gated on single live CD45+ cells for further analysis. (B) Results of FACS analysis. Percentages of T, B, NK cells, monocyte/macrophages, and DC were similar in homozygous B-hBTLA mice and C57BL/6 mice, demonstrating that introduction of hBTLA in place of its mouse counterpart does not change the overall development, differentiation, or distribution of these cell types in spleen. Values are expressed as mean ± SEM.
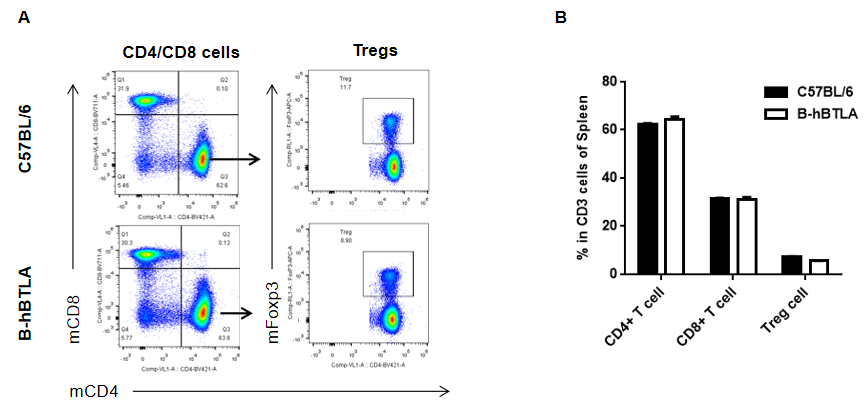
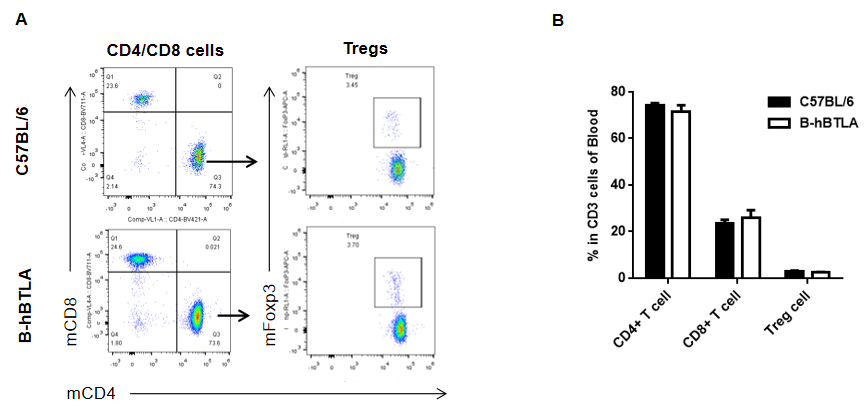
Analysis of splenic T cell subpopulations by FACS. Splenocytes were isolated from female C57BL/6 and B-hBTLA mice (n=3, 6 weeks-old) and analyzed by flow cytometry for T cell subsets. (A) Representative FACS plots gated on CD3+ T cells and further analyzed. (B) Results of FACS analysis. Percentages of CD8+, CD4+, and Treg cells were similar in homozygous B-hBTLA and C57BL/6 mice, demonstrating that introduction of hBTLA in place of its mouse counterpart does not change the overall development, differentiation or distribution of these T cell subtypes in spleen. Values are expressed as mean ± SEM.
Analysis of lymph node leukocyte subpopulations in B-hBTLA mice
Analysis of lymph node leukocyte subpopulations by FACS. Leukocytes were isolated from female C57BL/6 and B-hBTLA mice (n=3, 6 week-old) Flow cytometry analysis of the leukocytes was performed to assess leukocyte subpopulations. (A) Representative FACS plots gated on single live CD45+ cells for further analysis. (B) Results of FACS analysis. Percentages of T, B and NK cells were similar in homozygous B-hBTLA mice and C57BL/6 mice, demonstrating that introduction of hBTLA in place of its mouse counterpart does not change the overall development, differentiation, or distribution of these cell types in lymph node. Values are expressed as mean ± SEM.
Analysis of lymph node T cell subpopulations in B-hBTLA mice
Analysis of lymph node T cell subpopulations by FACS. Leukocytes were isolated from female C57BL/6 and B-hBTLA mice (n=3, 6 week-old) and analyzed by flow cytometry for T cell subsets. (A) Representative FACS plots gated on CD3+ T cells and further analyzed. (B) Results of FACS analysis. Percentages of CD8+, CD4+, and Treg cells were similar in homozygous B-hBTLA and C57BL/6 mice, demonstrating that introduction of hBTLA in place of its mouse counterpart does not change the overall development, differentiation or distribution of these T cell subtypes in lymph node. Values are expressed as mean ± SEM.
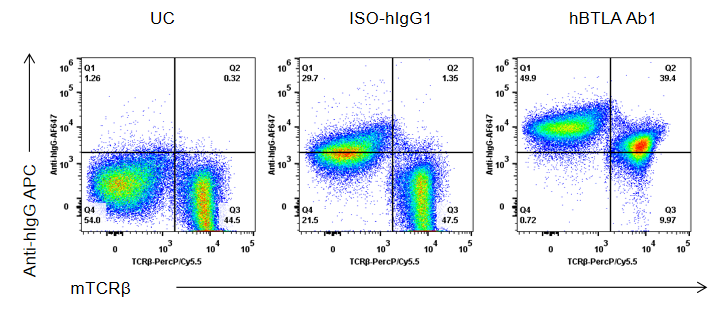
T cells in B-hBTLA mice bind anti-human BTLA antibody
Analysis of splenocytes of B-hBTLA mice by FACS. Splenocytes were isolated from homozygous B-hBTLA mice. Flow cytometry analysis of the splenocytes was performed to assess anti-human BTLA Ab1 binding with T cells. Single live cells were gated for CD45 population and used for further analysis as indicated here. T cell in homozygous B-hBTLA mice binds well with hBTLA Ab1 (in house) vs isotype control.
* When publishing results obtained using this animal model, please acknowledge the source as follows: The animal model [B-hBTLA mice] (Cat# 110005) was purchased from Biocytogen.