
C57BL/6-Cd3etm1(CD3E)Bcgen Cd3dtm1(CD3D)Bcgen Cd3gtm1(CD3G)Bcgen Ms4a1tm2(MS4A1)Bcgen/Bcgen • 121703
| Product name | B-hCD3EDG/hCD20 mice |
|---|---|
| Catalog number | 121703 |
| Strain name | C57BL/6-Cd3etm1(CD3E)Bcgen Cd3dtm1(CD3D)Bcgen Cd3gtm1(CD3G)Bcgen Ms4a1tm2(MS4A1)Bcgen/Bcgen |
| Strain background | C57BL/6 |
| NCBI gene ID | 915,916,917,931 (Human) |
| Aliases | B1; Bp35; CD20; CVID5; LEU-16; MS4A2; S7; CD3-DELTA; IMD19; T3D; CD3-GAMMA; IMD17; T3G; IMD18; T3E; TCRE; T3D; CD3-GAMMA; T3G; IMD18; TCRE; B1 |
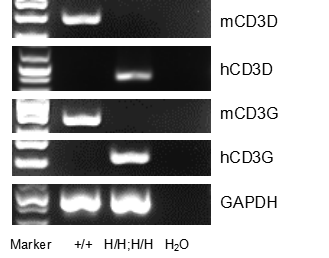
Strain specific analysis of CD3DG gene expression in wild type (WT) mice and B-hCD3EDG/hCD20 mice by RT-PCR. Mouse Cd3d and Cd3g mRNA were detectable only in thymocytes of WT mice (+/+). Human CD3D and CD3G mRNA were detectable only in homozygous B-hCD3EDG/hCD20 mice (H/H;H/H) but not in WT mice (+/+).
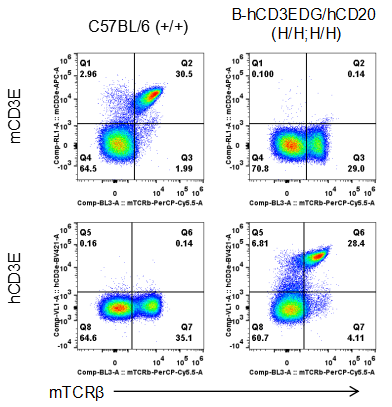
Strain specific CD3E expression analysis in homozygous B-hCD3EDG/hCD20 mice by flow cytometry. Splenocytes were collected from wild type (WT) mice (+/+) and homozygous B-hCD3EDG/hCD20 mice (H/H;H/H), and analyzed by flow cytometry with species-specific anti-CD3E antibody. Mouse CD3E was detectable in WT mice (+/+). Human CD3E was exclusively detectable in homozygous B-hCD3EDG/hCD20 mice (H/H;H/H) but not in WT mice (+/+).
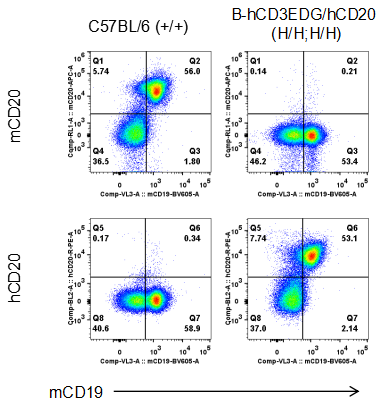
Strain specific CD20 expression analysis in homozygous B-hCD3EDG/hCD20 mice by flow cytometry. Splenocytes were collected from wild type (WT) mice (+/+) and homozygous B-hCD3EDG/hCD20 mice (H/H;H/H), and analyzed by flow cytometry with species-specific anti-CD20 antibody. Mouse CD20 was detectable in WT mice (+/+). Human CD20 was exclusively detectable in homozygous B-hCD3EDG/hCD20 mice (H/H;H/H) but not in WT mice (+/+).

Frequency of leukocyte subpopulations in spleen by flow cytometry. Splenocytes were isolated from wild-type C57BL/6 mice (female, n=3, 8-week-old) and homozygous B-hCD3EDG/hCD20 mice (female, n=3, 8-week-old). A. Flow cytometry analysis of the splenocytes was performed to assess the frequency of leukocyte subpopulations. B. Frequency of T cell subpopulations. Percentages of T cells, B cells, NK cells, dendritic cells, neutrophils, monocytes, macrophages, CD4+ T cells, CD8+ T cells and Tregs in B-hCD3EDG/hCD20 mice were similar to those in C57BL/6 mice. The same results were observed in blood and lymph node. The data was not shown. Values are expressed as mean ± SEM. Significance was determined by two-way ANOVA test. *P < 0.05, **P < 0.01, ***p < 0.001.
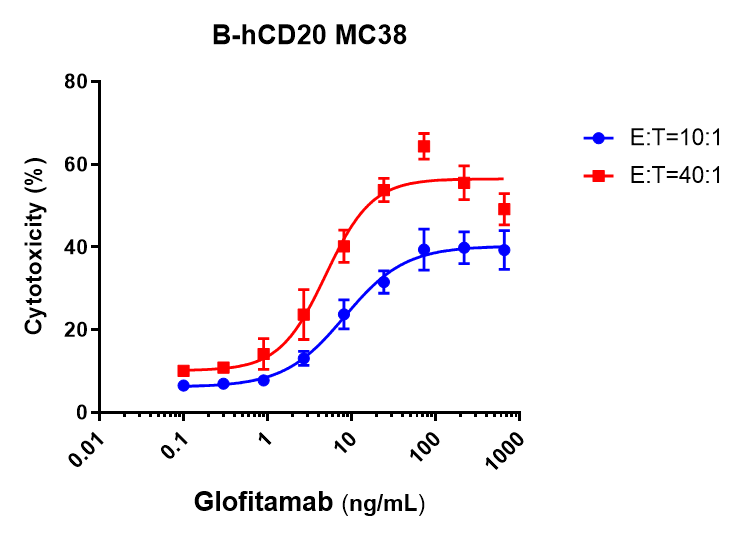
In Vitro Cytotoxicity Evaluation of an Anti-CD3/CD20 Bispecific Antibody-Glofitamab against Human CD20–Expressing MC38 Cells. B-hCD20 MC38 cells were labeled with a violet cell tracker fluorescent dye and seeded into 96-well plates. On the following day, splenocytes isolated from B-hCD3EDG/hCD20 mice were added and cocultured with the target cells in the presence of various concentrations of the CD3/CD20 bispecific antibody. Cytotoxic activity was assessed after 48 hours of incubation. Effector-to-target (E:T) cell ratios of 10:1 and 40:1 were used. The anti-CD3/CD20 bispecific antibody mediated dose-dependent cytotoxicity against B-hCD20 MC38 cells in the presence of effector cells. Increased tumor cell killing was observed with higher effector-to-target (E:T) ratios.
Anti-CD3/CD20 BsAb Induce Cytokine Storm (CRS) in B-hCD3EDG/hCD20 mice. B-hCD3EDG/hCD20 mice (female, 6-week-old, n=5) were treated once intravenously on day0 with antibodies (Commercialized) indicated in the panel. Multiplex analysis of cytokines in serum at 4, 24 and 72 h after administration. Values are expressed as mean ± SEM. Significance was determined by two-way ANOVA test. *P < 0.05, **P < 0.01, ***P < 0.001.
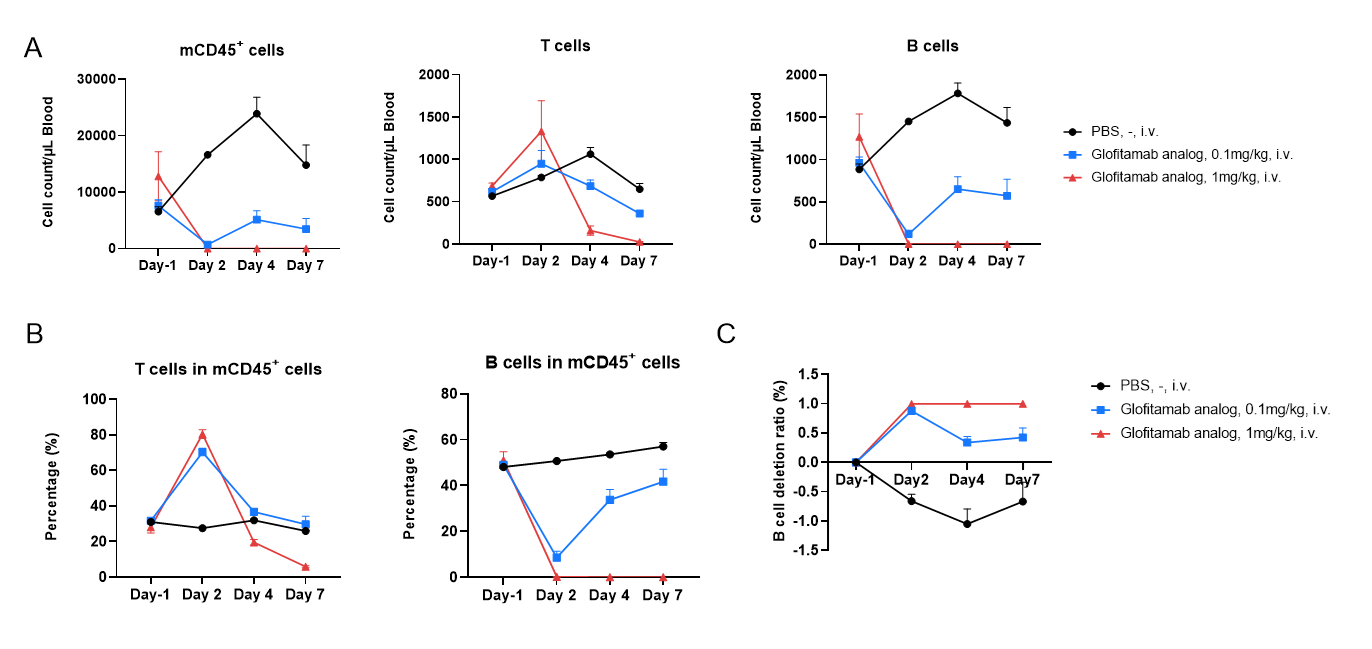
In vivo B cell depletion by a CD3 x CD20 bsAb in B-hCD3EDG/hCD20 mice. Anti–human CD3/CD20 bispecific antibody Glofitamab analog (Commercialized) and PBS were administered into B-hCD3EDG/hCD20 mice (female, 8-week-old, n=3) through a single dose injection. Blood were collected at Day-1, Day2, Day4 and Day7 after treatment. The numbers and the frequency of mCD45+ cells, B cells (mCD19+) and T cells (mTCRβ+) were determined by flow cytometry. (A) The number of CD45+ cells, B cells and T cells in blood. (B) The proportion of T and B cells in the CD45+ cells. (C) B cell depletion ratio. The results indicate that Glofitamab analog can effectively eliminate B cells in B-hCD3EDG/hCD20 mice.

Antitumor Activity of Anti-Human CD3/CD20 Bispecific Antibodies (Glofitamab, Commercialized) in B-hCD3EDG/hCD20 Mice. B-hCD20 MC38 mouse colon carcinoma cells were subcutaneously implanted into homozygous B-hCD3EDG/hCD20 mice (female, 9-week-old, n=6). Mice were grouped once tumor volume reached approximately 100 mm³, at which time they were intravenously injected with anti-human CD3/CD20 bispecific antibodies (indicated in the panel). (A) Anti-human CD3/CD20 bispecific antibodies inhibited B-hCD20 MC38 tumor growth in B-hCD3EDG/hCD20 mice. (B) Body weight changes during treatment. Values are expressed as mean ± SEM.
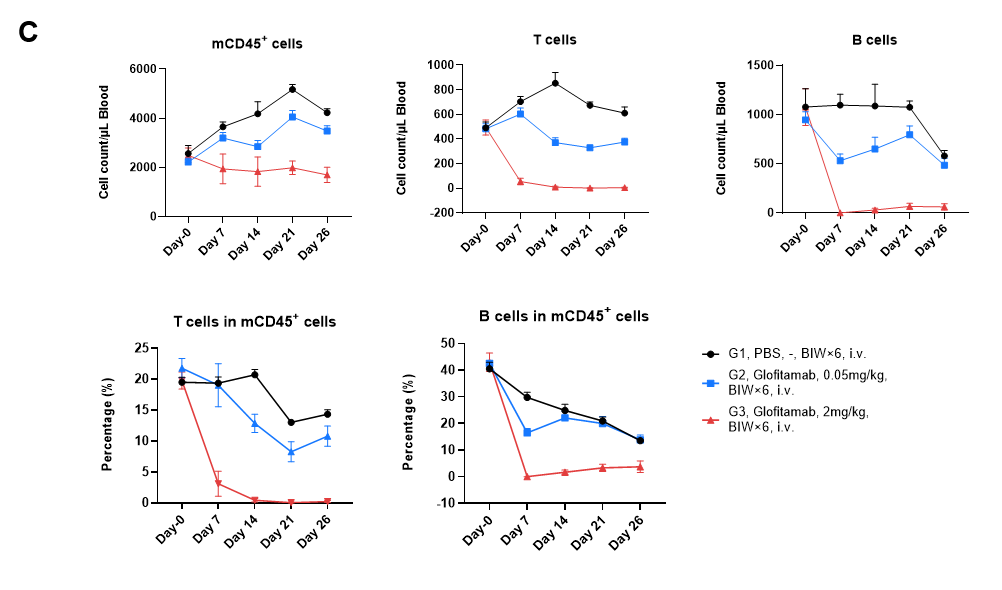
(C) Anti-CD3/CD20 BsAb Glofitamab depletes B cells in blood of B-hCD3EDG/hCD20 mice bearing B-hCD20 MC38 tumor. During in vivo efficacy study described in previous page, blood were collected at Day 0, Day7, Day14, Day21 and Day 26 after grouping. The numbers and the frequency of mCD45+ cells, B cells (mCD19+) and T cells (mTCRβ+) were determined by flow cytometry. The results indicate that Glofitamab can effectively eliminate B cells and induced T cells death in B-hCD3EDG/hCD20 mice. Values are expressed as mean ± SEM.
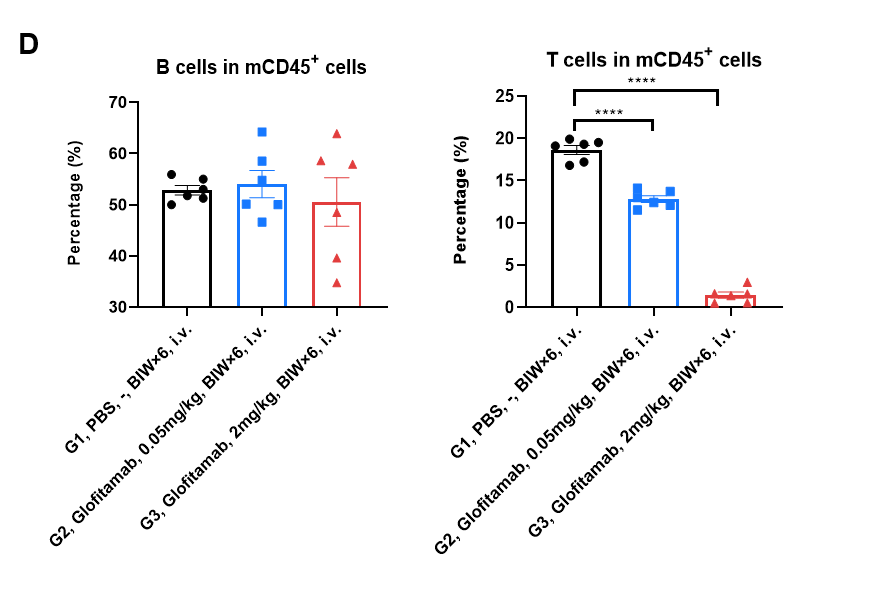
(D) At the end of the experiment, spleen cells were collected and the frequency of B cells (mCD19+) and T cells (mTCRβ+) in mCD45+ cells were determined by flow cytometry. The results indicate that Glofitamab can effectively induced T cells death but not eliminate B cells in B-hCD3EDG/hCD20 mice. Values are expressed as mean ± SEM. Significance was determined by Ordinary one-way ANOVA. *P < 0.05, **P < 0.01, ***P < 0.001.
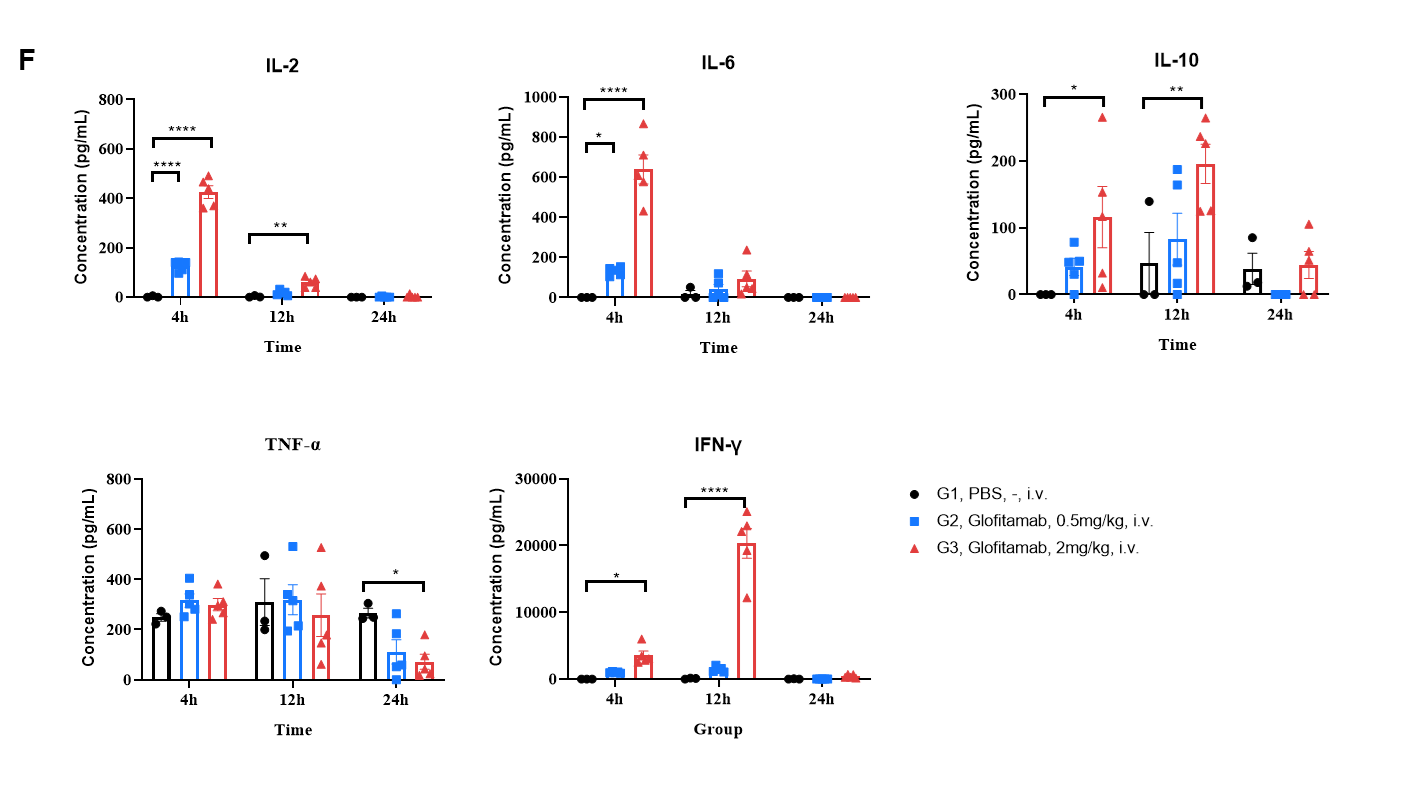
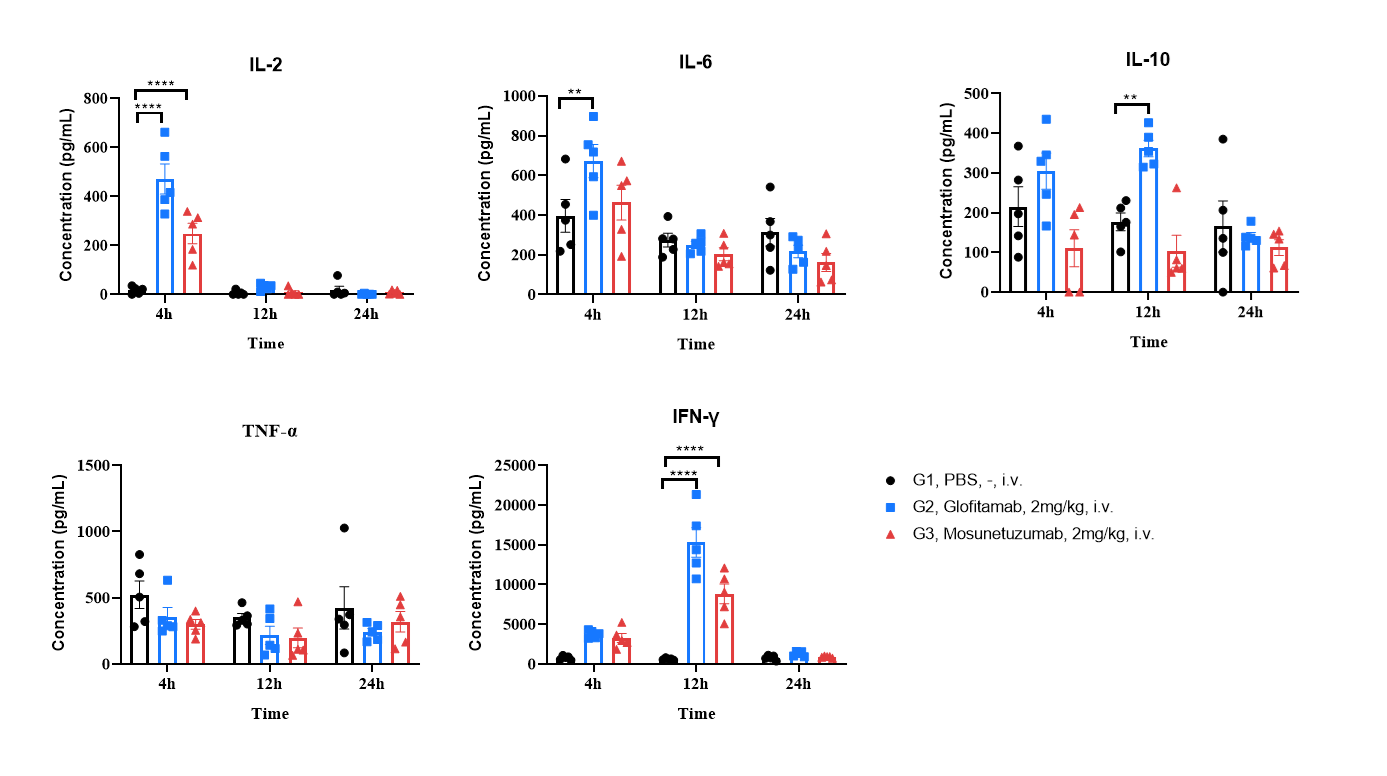
(F) Anti-CD3/CD20 BsAb Induce Cytokine Storm (CRS) in B-hCD3EDG/hCD20 mice Bearing B-hCD20 MC38 cells. During in vivo efficacy study described in previous page, blood were collected at 4, 12, 24 hours after first dosing. Values are expressed as mean ± SEM. Significance was determined by two-way ANOVA test. *P < 0.05, **P < 0.01, ***P < 0.001.
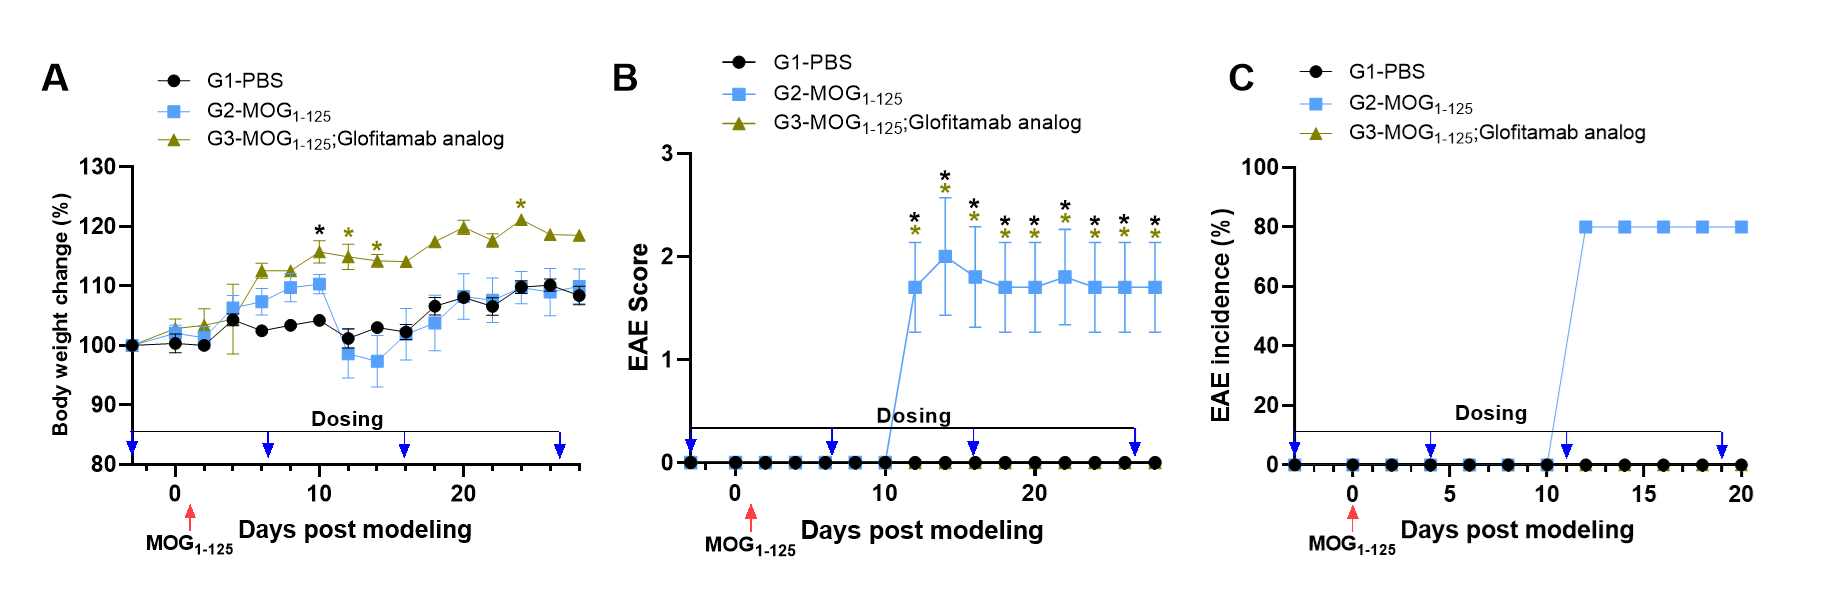
Effects of anti-human CD3/CD20 bispecific antibody (BsAb) Glofitamab Analog on MOG₁₋₁₂₅-Induced EAE. Mice received MOG₁₋₁₂₅ on day 0 and day 1. Body weight (A), clinical score (B), and EAE incidence (C) were recorded. Glofitamab analog effectively alleviated EAE symptoms. Statistical analysis was performed using two-way ANOVA with Dunnett’s test (n = 3–5; *P < 0.05, **P < 0.01 vs. G2).
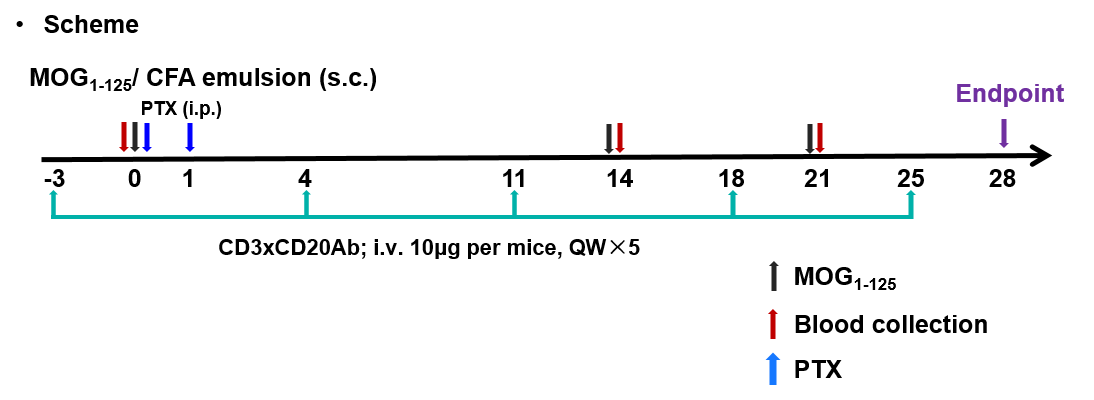

Effects of the anti-CD3×CD20 antibody (Glofitamab analog) on MOG1-125-induced experimental autoimmune encephalomyelitis (EAE). Mice were subcutaneously injected with MOG1-125 emulsion in the neck and buttock regions on day 0. Pertussis toxin (PTX) was administered intraperitoneally at 2 and 24 hours after MOG immunization (G2, G3). The control group (G2) and the anti-CD3×CD20 antibody-treated group (G3) were administered QW. Body weight (A) and clinical scores (B) were recorded every other day. Data are presented as mean ± SEM.
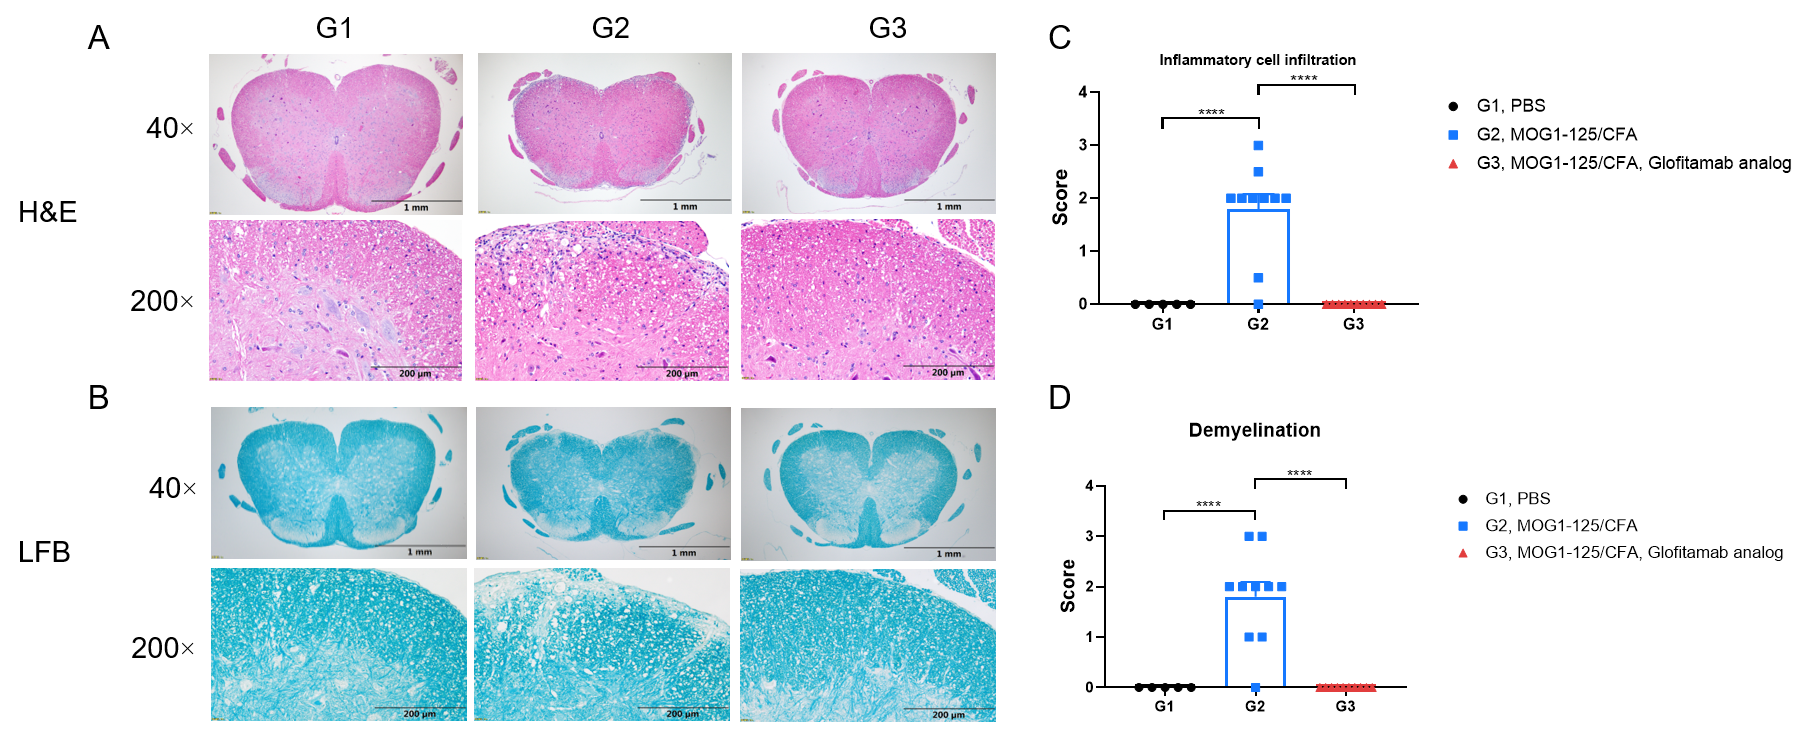
Effects of anti-CD3×CD20 antibody (Glofitamab analog) in inflammatory cell infiltration and demyelination in EAE model. Spinal cords were removed from B-hCD3EDG/hCD20 mice on day 28 and stained with Hematoxylin and eosin (H&E) (A) or Luxol fast blue (LFB) (B). Representative sections are shown. The score of inflammatory cells and demyelination of spinal cord (C&D). Values are expressed as mean ± SEM, Versus G2, **** p<0.0001.

Effects of anti-CD3×CD20 antibody on the level of T, B cells in MOG1-125 induced EAE. Blood were collected on day 0, 14, 21 and the endpoint 28. Levels of T, B cells were evaluated by flow cytometry. Values are expressed as mean ± SEM. Two-way ANOVA with Dunnett’s test. n=5-10, *P<0.05, **P<0.01, ***P<0.001, ****P<0.001 Versus G2.

Effects of anti-CD3×CD20 antibody on the level of T and B cells in MOG1-125 induced EAE. Spleen, brain and spinal cord were collected on the endpoint 28. Levels of T and B were evaluated by flow cytometry. Values are expressed as mean ± SEM. Two-way ANOVA with Dunnett’s test. n=5-10, *P<0.05, **P<0.01, ***P<0.001, ****P<0.001 Versus G2.