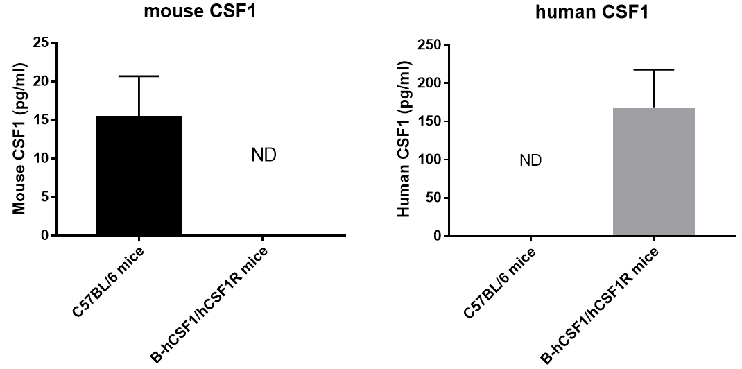
Protein expression analysis
Strain specific CSF1 expression analysis in homozygous B-hCSF1/hCSF1R mice by ELISA. Splenocytes were collected from wild-type C57BL/6 mice (+/+) and homozygous B-hCSF1/hCSF1R mice (H/H) stimulated with LPS in vivo, and analyzed by ELISA with species-specific anti-CSF1 ELISA kit. Mouse CSF1 was detectable in wild-type mice. Human CSF1 was exclusively detectable in homozygous B-hCSF1/hCSF1R but not in wild-type mice. ND: Not detected.
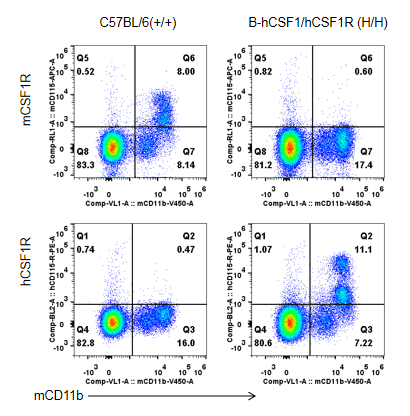
Strain specific CSF1R expression analysis in homozygous B-hCSF1/hCSF1R mice by flow cytometry. Blood were collected from wild-type C57BL/6 mice (+/+) and homozygous B-hCSF1/hCSF1R mice (H/H), and analyzed by flow cytometry with species-specific anti-CSF1R antibody. Mouse CSF1R was detectable in wild-type mice. Human CSF1R was exclusively detectable in homozygous B-hCSF1/hCSF1R but not in wild-type mice.
Combination therapy of anti-mouse PD-L1 antibody and anti-human CSF1R antibody
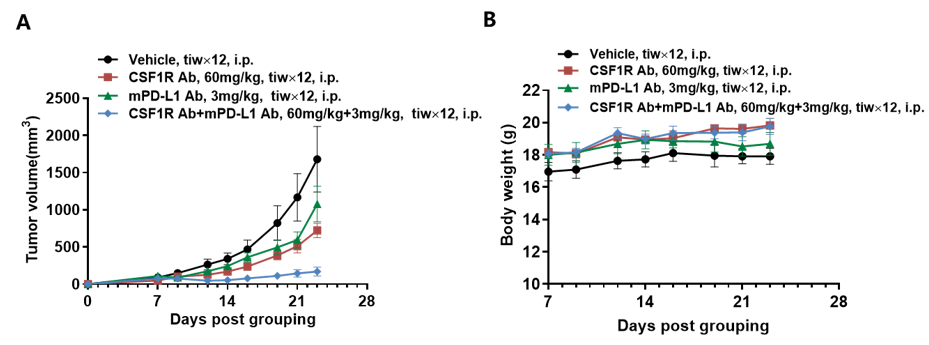
Antitumor activity of anti-mouse PD-L1 antibody combined with anti-human CSF1R antibody in B-hCSF1/hCSF1R mice. (A) Anti-mouse PD-L1 antibody combined with anti-human CSF1R antibody inhibited hCSF1-MC38 tumor growth in B-hCSF1/hCSF1R mice. Murine colon cancer hCSF1-MC38 cells (5Χ105) (hCSF1-MC38 cells provided by a client) were subcutaneously implanted into homozygous B-hCSF1/hCSF1R mice (female, n=5). Mice were grouped on the first day, at which time they were treated with anti-mouse PD-L1 antibody (provided by a client) and anti-human CSF1R antibody (provided by a client) with doses and schedules indicated in panel A. (B) Body weight changes during treatment. As shown in panel A, anti-human CSF1R antibody and combination of anti-mouse PD-L1 antibody and anti-human CSF1R antibody were efficacious in controlling tumor growth in B-hCSF1/hCSF1R mice, demonstrating that the B-hCSF1/hCSF1R mice provide a powerful model for in vivo evaluation of anti-human CSF1R antibodies and their combination with PD-L1 antibodies. Values are expressed as mean ± SEM.
Note: This experiment was performed by the client using B-hCSF1/hCSF1R mice. All the other materials were provided by the client.
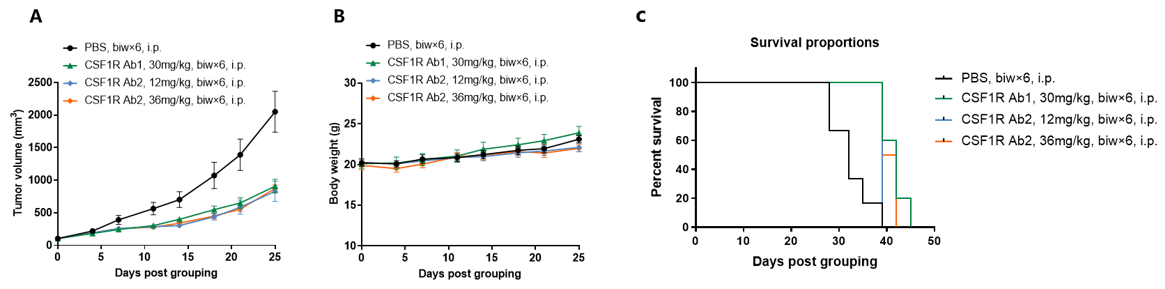
In vivo efficacy of anti-human CSF1R antibodies
Antitumor activity of anti-human CSF1R antibodies in B-hCSF1/hCSF1R mice. (A) Anti-human CSF1R antibodies inhibited MC38 tumor growth in B-hCSF1/hCSF1R mice. Murine colon cancer MC38 cells were subcutaneously implanted into homozygous B-hCSF1/hCSF1R mice (female, 6-7-week-old, n=6). Mice were grouped when tumor volume reached approximately 100 mm3, at which time they were treated with two anti-human CSF1R antibodies with doses and schedules indicated in panel. (B) Body weight changes during treatment. (C) Mouse survival after grouping. As shown in panel A and C, anti-human CSF1R antibodies were efficacious in controlling tumor growth in B-hCSF1/hCSF1R mice, demonstrating that the B-hCSF1/hCSF1R mice provide a powerful preclinical model for in vivo evaluation of anti-human CSF1R antibodies. Values are expressed as mean ± SEM.
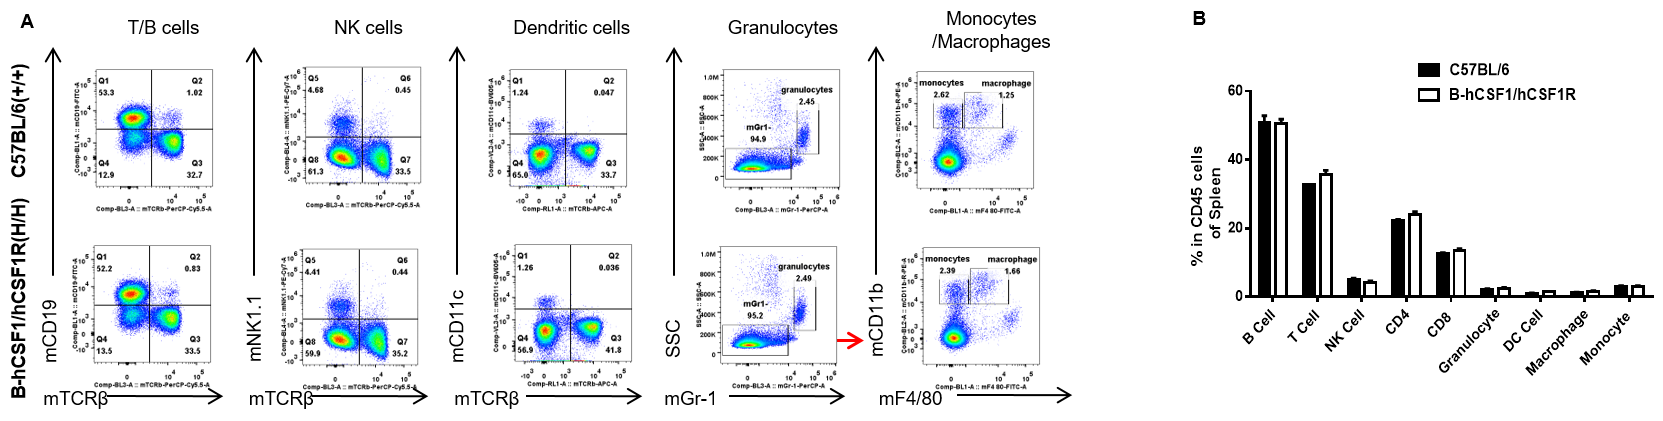
Analysis of leukocytes subpopulation in B-hCSF1/hCSF1R mice
Analysis of spleen leukocyte subpopulations by FACS. Splenocytes were isolated from female C57BL/6 and B-hCSF1/hCSF1R mice (n=3, 8-week-old). Flow cytometry analysis of the splenocytes was performed to assess leukocyte subpopulations. A. Representative FACS plots. Single live cells were gated for the CD45+ population and used for further analysis as indicated here. B. Results of FACS analysis. Percent of T cells, B cells, NK cells, dendritic cells, granulocytes, monocytes and macrophages in homozygous B-hCSF1/hCSF1R mice were similar to those in the C57BL/6 mice, demonstrating that CSF1/hCSF1R humanized does not change the overall development, differentiation or distribution of these cell types in spleen. Values are expressed as mean ± SEM.
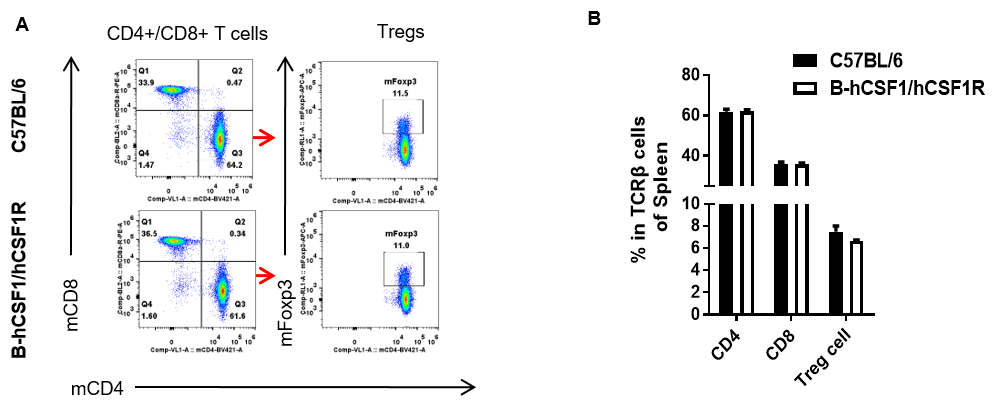
Analysis of spleen T cell subpopulations in B-hCSF1/hCSF1R mice
Analysis of spleen T cell subpopulations by FACS. Splenocytes were isolated from female C57BL/6 and B-hCSF1/hCSF1R mice (n=3, 8-week-old). Flow cytometry analysis of the splenocytes was performed to assess leukocyte subpopulations. A. Representative FACS plots. Single live CD45+ cells were gated for CD3+ T cell population and used for further analysis as indicated here. B. Results of FACS analysis. The percent of CD8+ T cells, CD4+ T cells, and Tregs in homozygous B-hCSF1/hCSF1R mice were similar to those in the C57BL/6 mice, demonstrating that introduction of hCSF1/hCSF1R in place of its mouse counterpart does not change the overall development, differentiation or distribution of these T cell subtypes in spleen. Values are expressed as mean ± SEM.
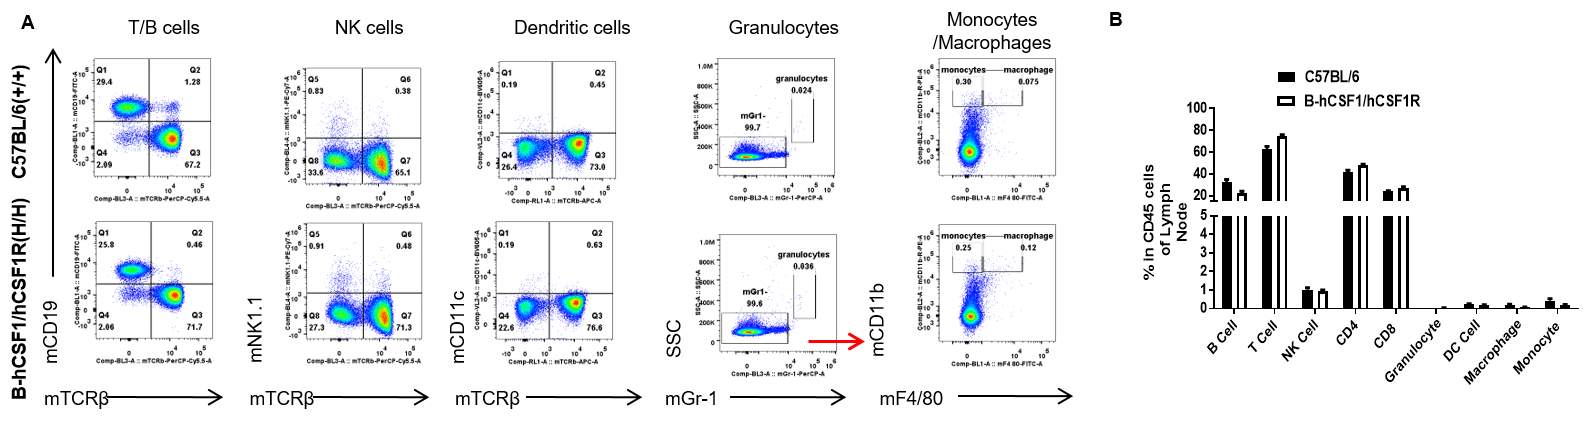
Analysis of lymph node leukocytes subpopulations in B-hCSF1/hCSF1R mice
Analysis of lymph node leukocyte subpopulations by FACS. Leukocytes were isolated from female C57BL/6 and B-hCSF1/hCSF1R mice (n=3, 8-week-old) Flow cytometry analysis of the leukocytes was performed to assess leukocyte subpopulations. A. Representative FACS plots. Single live cells were gated for CD45+ population and used for further analysis as indicated here. B. Results of FACS analysis Percent of T cells, B cells, NK cells, dendritic cells, granulocytes, monocytes and macrophages in homozygous B-hCSF1/hCSF1R mice were similar to those in the C57BL/6 mice, demonstrating that introduction of hCSF1/hCSF1R in place of its mouse counterpart does not change the overall development, differentiation or distribution of these cell types in lymph node. Values are expressed as mean ± SEM.
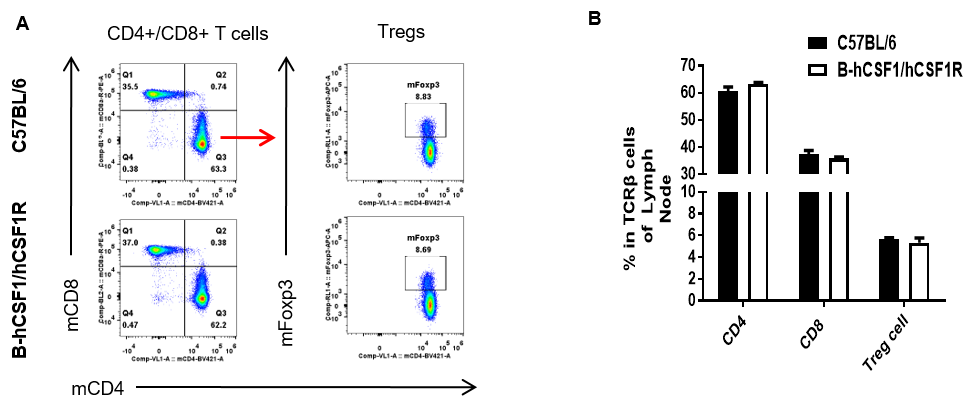
Analysis of lymph node leukocyte subpopulations by FACS. Leukocytes were isolated from female C57BL/6 and B-hCSF1/hCSF1R mice (n=3, 8- week-old) Flow cytometry analysis of the leukocytes was performed to assess leukocyte subpopulations. Representative FACS plots. Single live CD45+ cells were gated for CD3+ T cell population and used for further analysis as indicated here. B. Results of FACS analysis. The percent of CD8+ T cells, CD4+ T cells, and Tregs in homozygous B-hCSF1/hCSF1R mice were similar to those in the C57BL/6 mice, demonstrating that introduction of hCSF1/hCSF1R in place of its mouse counterpart does not change the overall development, differentiation or distribution of these cell types in lymph node. Values are expressed as mean ± SEM.
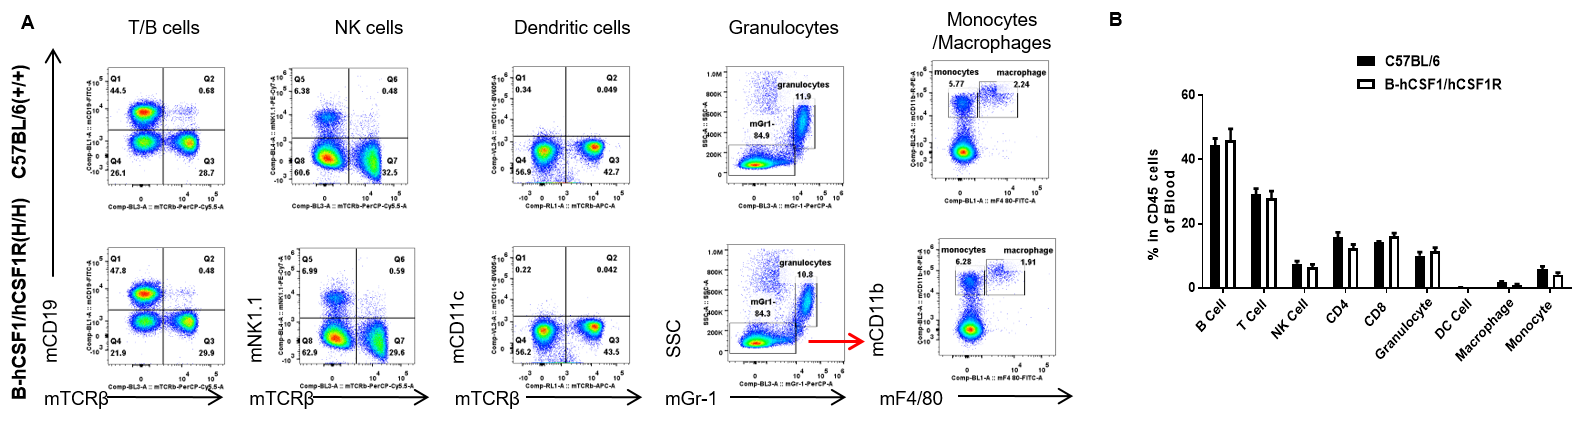
Analysis of blood leukocytes subpopulations in B-hCSF1/hCSF1R mice
Analysis of blood leukocyte subpopulations by FACS. Leukocytes were isolated from female C57BL/6 and B-hCSF1/hCSF1R mice (n=3, 8-week-old) Flow cytometry analysis of the leukocytes was performed to assess leukocyte subpopulations. A. Representative FACS plots. Single live cells were gated for CD45+ population and used for further analysis as indicated here. B. Results of FACS analysis Percent of T cells, B cells, NK cells, dendritic cells, granulocytes, monocytes and macrophages in homozygous B-hCSF1/hCSF1R mice were similar to those in the C57BL/6 mice, demonstrating that introduction of hCSF1/hCSF1R in place of its mouse counterpart does not change the overall development, differentiation or distribution of these cell types in blood. Values are expressed as mean ± SEM.
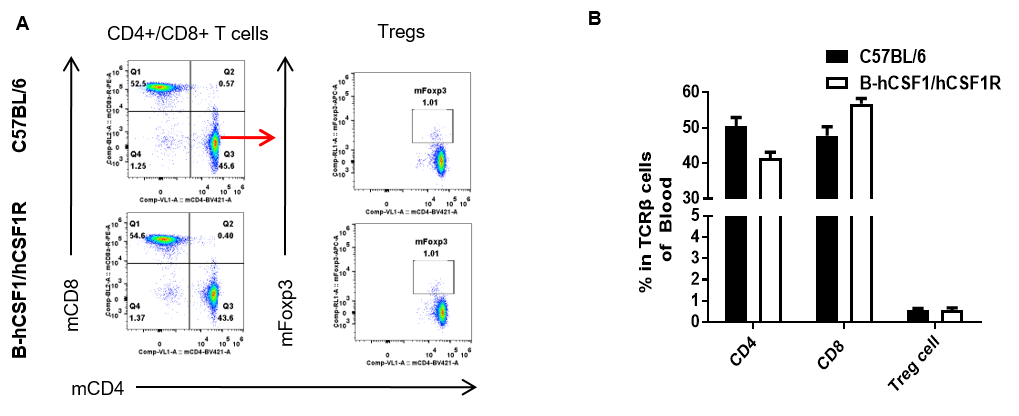
Analysis of blood leukocyte subpopulations by FACS. Leukocytes were isolated from female C57BL/6 and B-hCSF1/hCSF1R mice (n=3, 8-week-old) Flow cytometry analysis of the leukocytes was performed to assess leukocyte subpopulations. Representative FACS plots. Single live CD45+ cells were gated for CD3+ T cell population and used for further analysis as indicated here. B. Results of FACS analysis. The percent of CD8+ T cells, CD4+ T cells, and Tregs in homozygous B-hCSF1/hCSF1R mice were similar to those in the C57BL/6 mice, demonstrating that introduction of hCSF1/hCSF1R in place of its mouse counterpart does not change the overall development, differentiation or distribution of these cell types in blood. Values are expressed as mean ± SEM.
* When publishing results obtained using this animal model, please acknowledge the source as follows: The animal model [B-hCSF1/hCSF1R mice] (Cat# 121109) was purchased from Biocytogen.