

GLP1R (Glucagon-like peptide-1 receptor) is a G protein–coupled receptor (GPCR) highly expressed in pancreatic β-cells and critical for glucose-dependent insulin secretion, appetite regulation, and energy balance. GLP1R is the therapeutic target of GLP-1 receptor agonists (GLP-1RAs), such as semaglutide and liraglutide, which are widely used for the treatment of type 2 diabetes and obesity.
In GLP1R humanized mice, the murine Glp1r gene is replaced with the human GLP1R gene. Homozygous mice express human GLP1R in physiologically relevant tissues without altering immune or metabolic homeostasis. This model provides a translationally relevant platform for preclinical efficacy testing, antibody validation, and drug development targeting GLP1R.
GLP1R humanized mice are an ideal preclinical model for evaluating GLP1R-targeted therapeutics in metabolic disease research, including type 2 diabetes and obesity.
Key Advantages
Validation
Applications

GLP1R

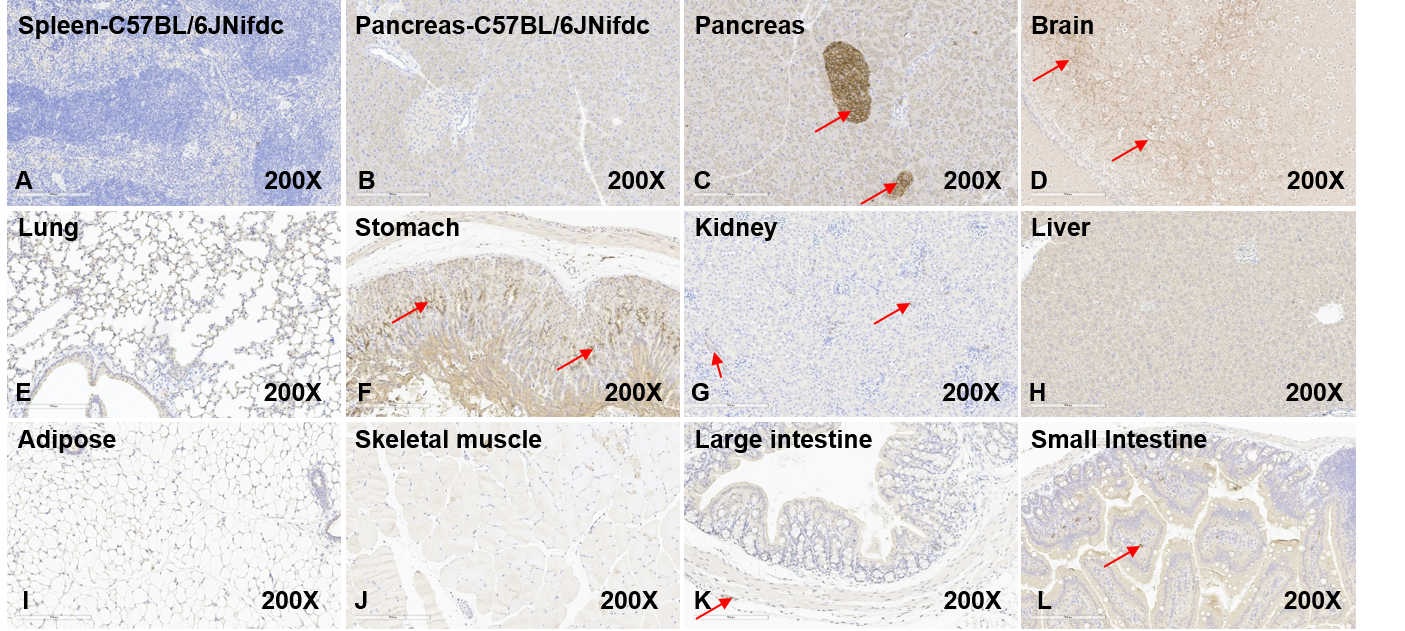
Immunohistochemical analysis of human GLP1R protein expression in different tissues of GLP1R humanized mice. Tissue sections were stained with a human-specific anti-GLP1R antibody (Abcam, ab254352) to assess human GLP1R protein expression by immunohistochemistry (IHC). (A) Spleen tissue from wild-type C57BL/6JNifdc mice served as a negative tissue control. (B) No human GLP1R expression was detected in the pancreas of wild-type C57BL/6JNifdc mice. (C, D, F, G, K, L) Human GLP1R expression was detected in the pancreas, brain, stomach, kidney, large intestine, and small intestine of GLP1R humanized mice. (E, H, I, J) No human GLP1R expression was detected in the lung, liver, adipose tissue, or skeletal muscle of GLP1R humanized mice. Original magnification: ×200. IHC, immunohistochemistry.
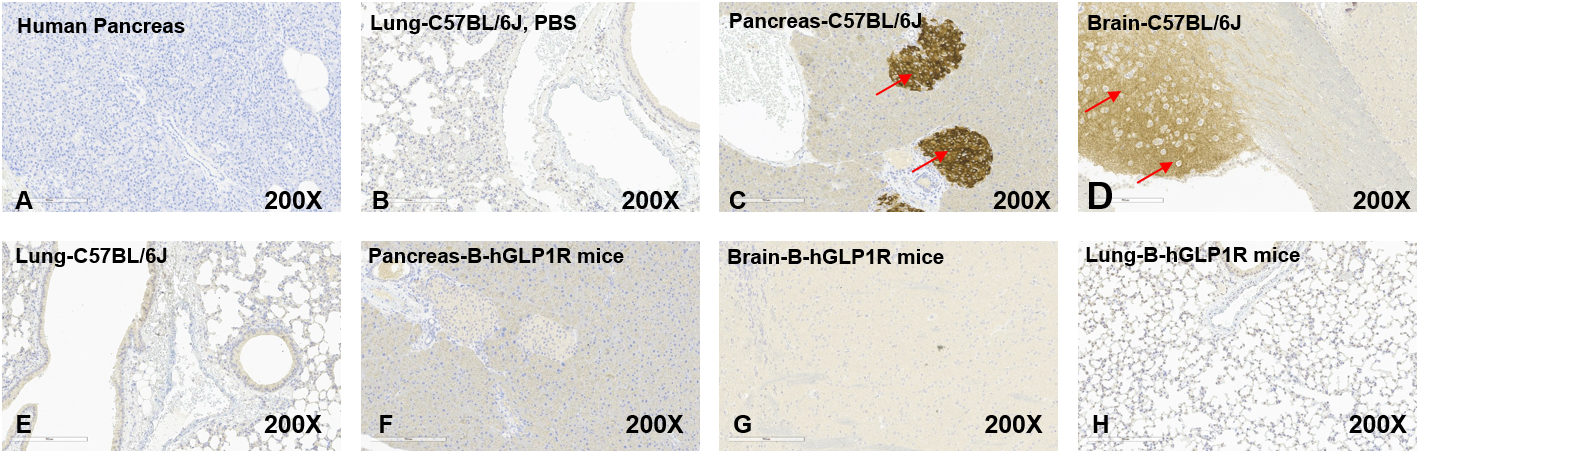
Immunohistochemical analysis of mouse GLP1R protein expression in different tissues of wild-type mice and GLP1R humanized mice. Tissue sections were stained with a mouse-specific anti-GLP1R antibody (Abcam, ab218532) to assess mouse GLP1R protein expression by immunohistochemistry (IHC). (A) Human pancreatic tissue served as a negative tissue control. (C, D) Mouse GLP1R expression was detected in the pancreas and brain of wild-type C57BL/6JNifdc mice. (E) No mouse GLP1R expression was detected in the lung of wild-type C57BL/6JNifdc mice. (F, G, H) No mouse GLP1R expression was detected in the pancreas, brain, or lung of GLP1R humanized mice. Original magnification: ×200. IHC, immunohistochemistry.
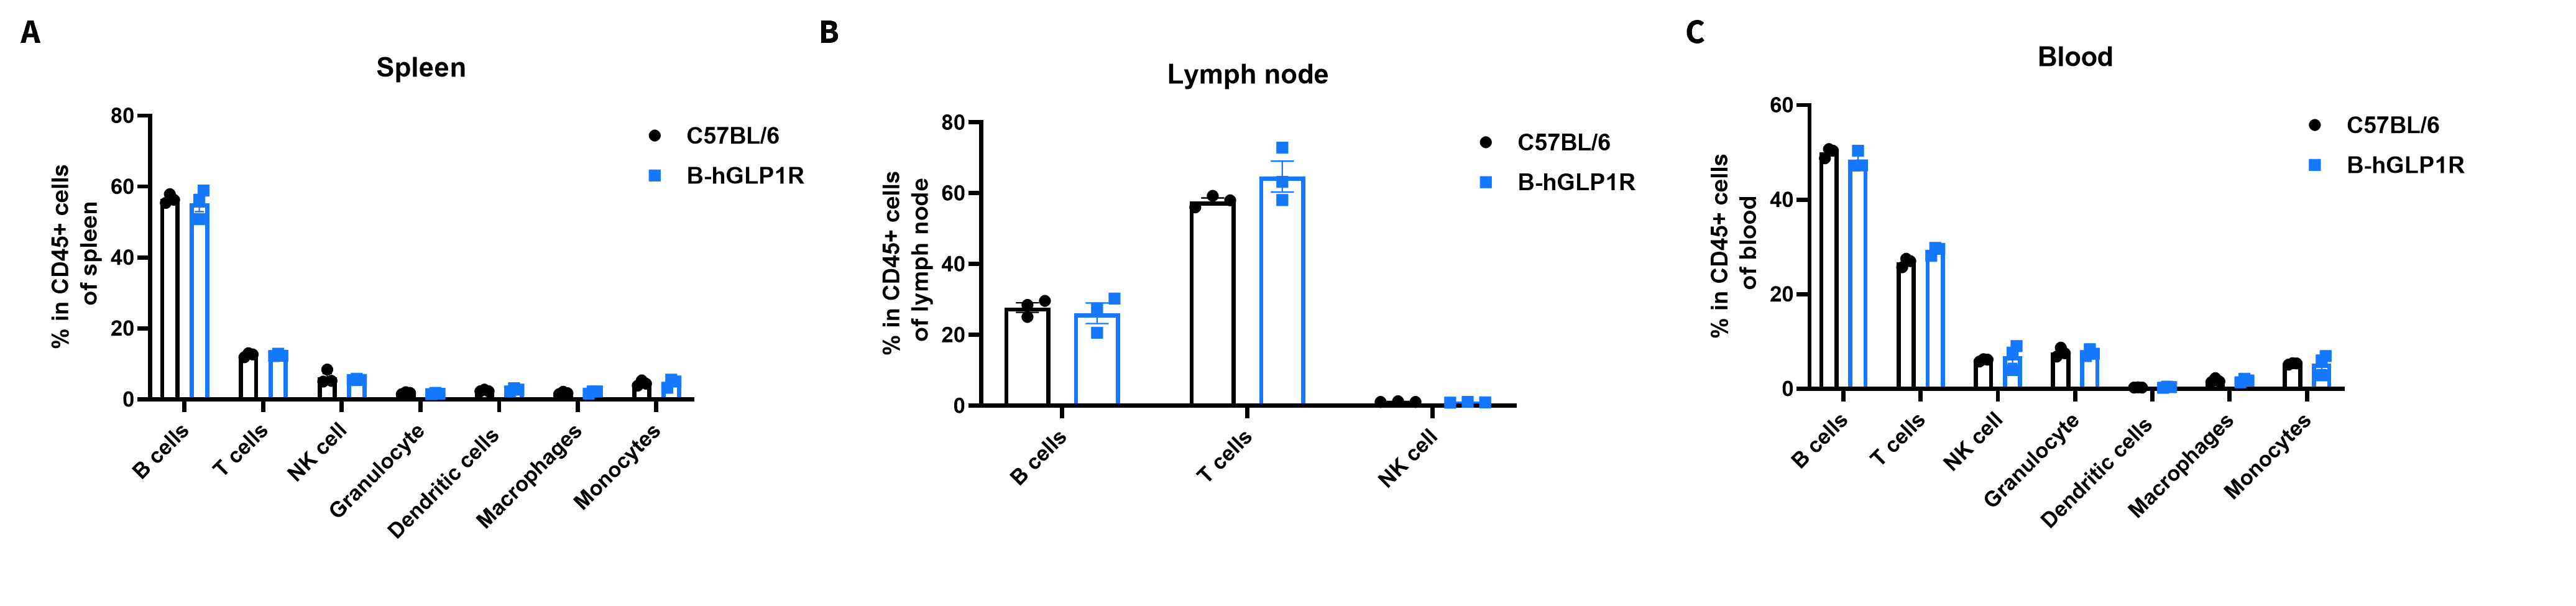
Flow cytometry analysis of leukocyte subpopulations in immune organs and peripheral blood of GLP1R humanized mice. Splenocytes, peripheral blood, and lymph nodes were isolated from female C57BL/6 mice and GLP1R humanized mice (9 weeks old, n = 3). Single live cells were gated on the CD45⁺ population and analyzed by flow cytometry as indicated. Values are expressed as mean ± SEM.
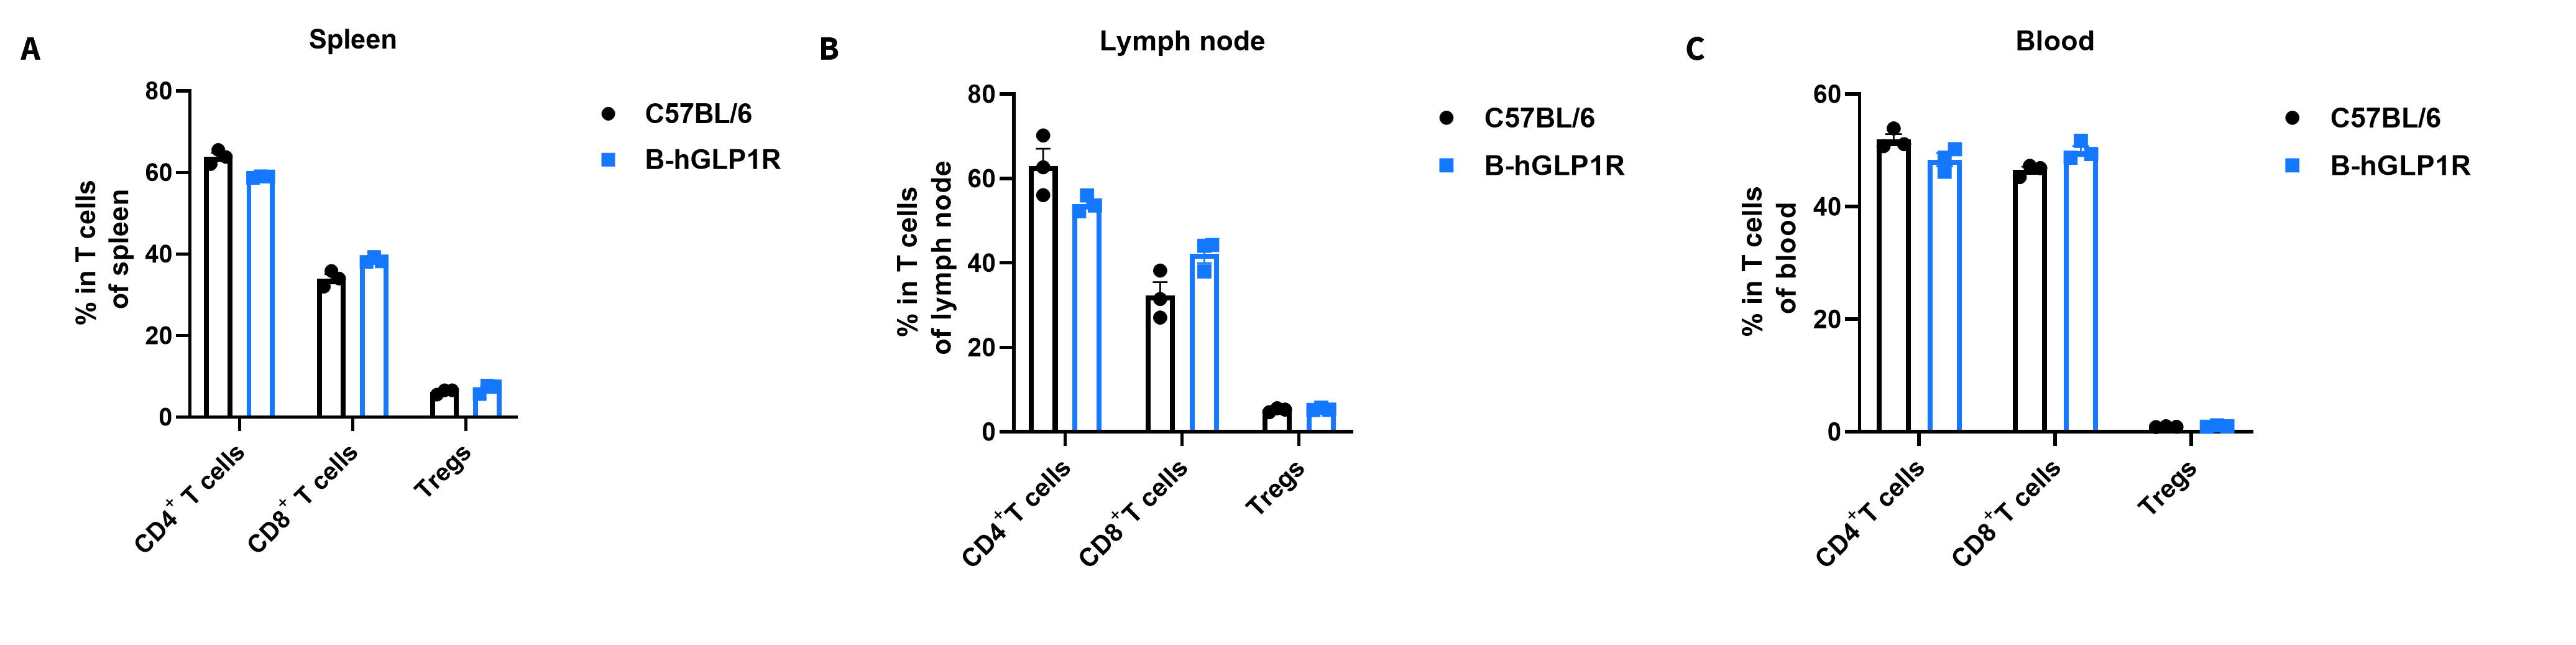
Analysis of T-cell subpopulations by flow cytometry in immune organs and blood. Splenocytes, peripheral blood, and lymph nodes were isolated from C57BL/6 and GLP1R humanized mice (female, 9-week-old, n = 3). Single live cells were gated on the CD3⁺ T-cell population and analyzed by flow cytometry as indicated. Values are expressed as mean ± SEM.
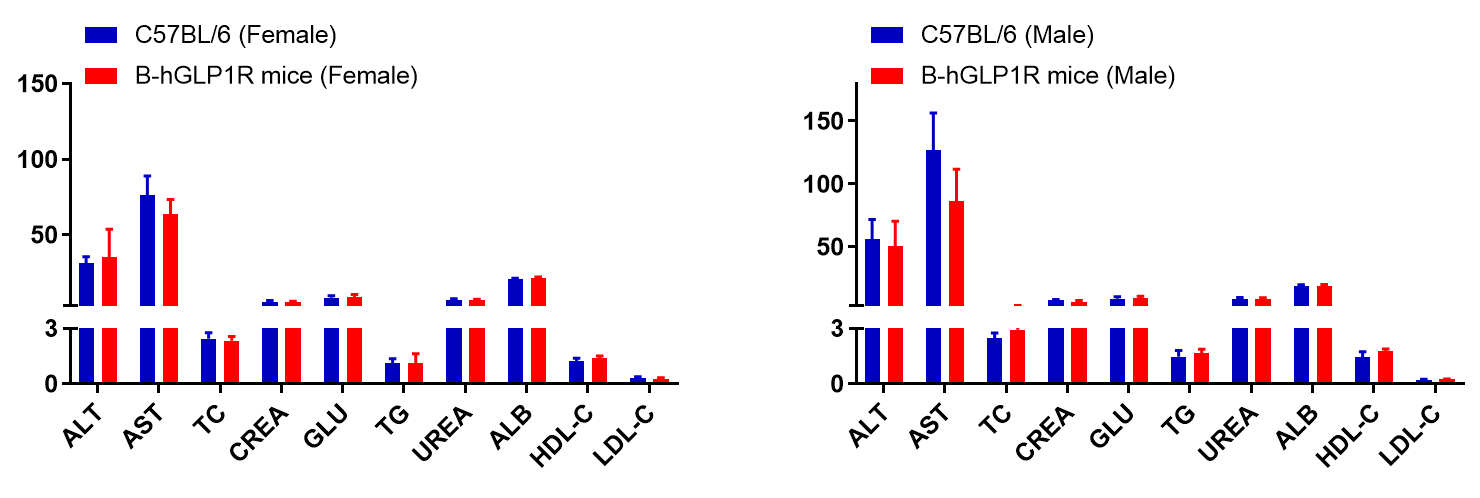
Blood biochemical parameters of GLP1R humanized mice are shown. Values are expressed as mean ± SD.
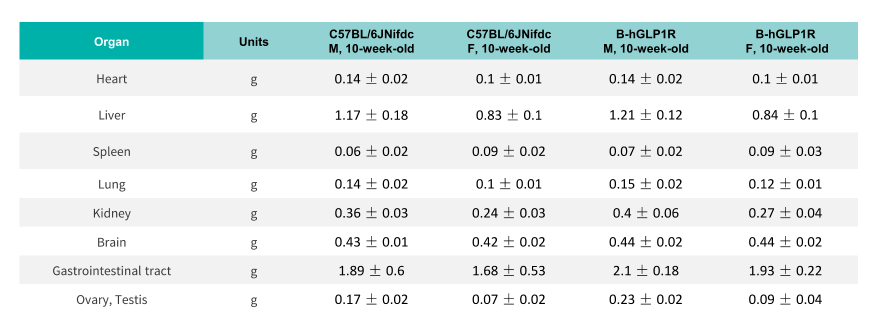
Average weights of major organs in GLP1R humanized mice.
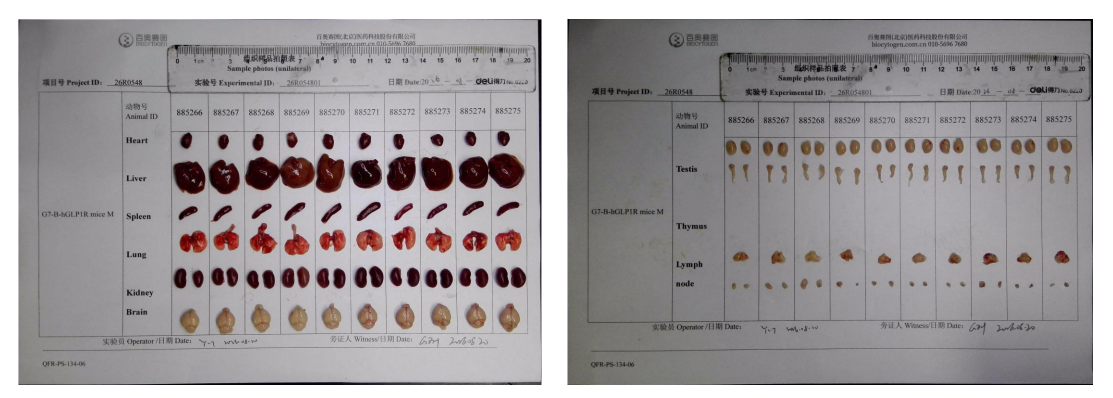
Organs of male GLP1R humanized mice (10-week-old, n = 10).
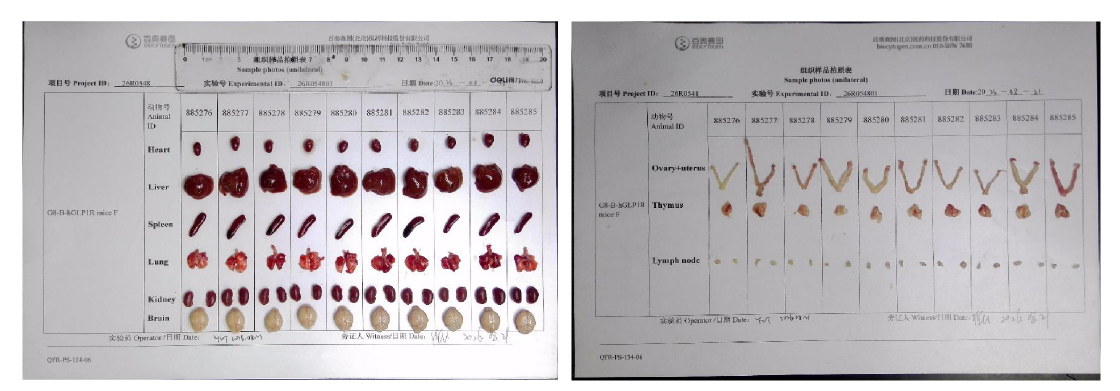
Organs of female GLP1R humanized mice (10-week-old, n = 10).

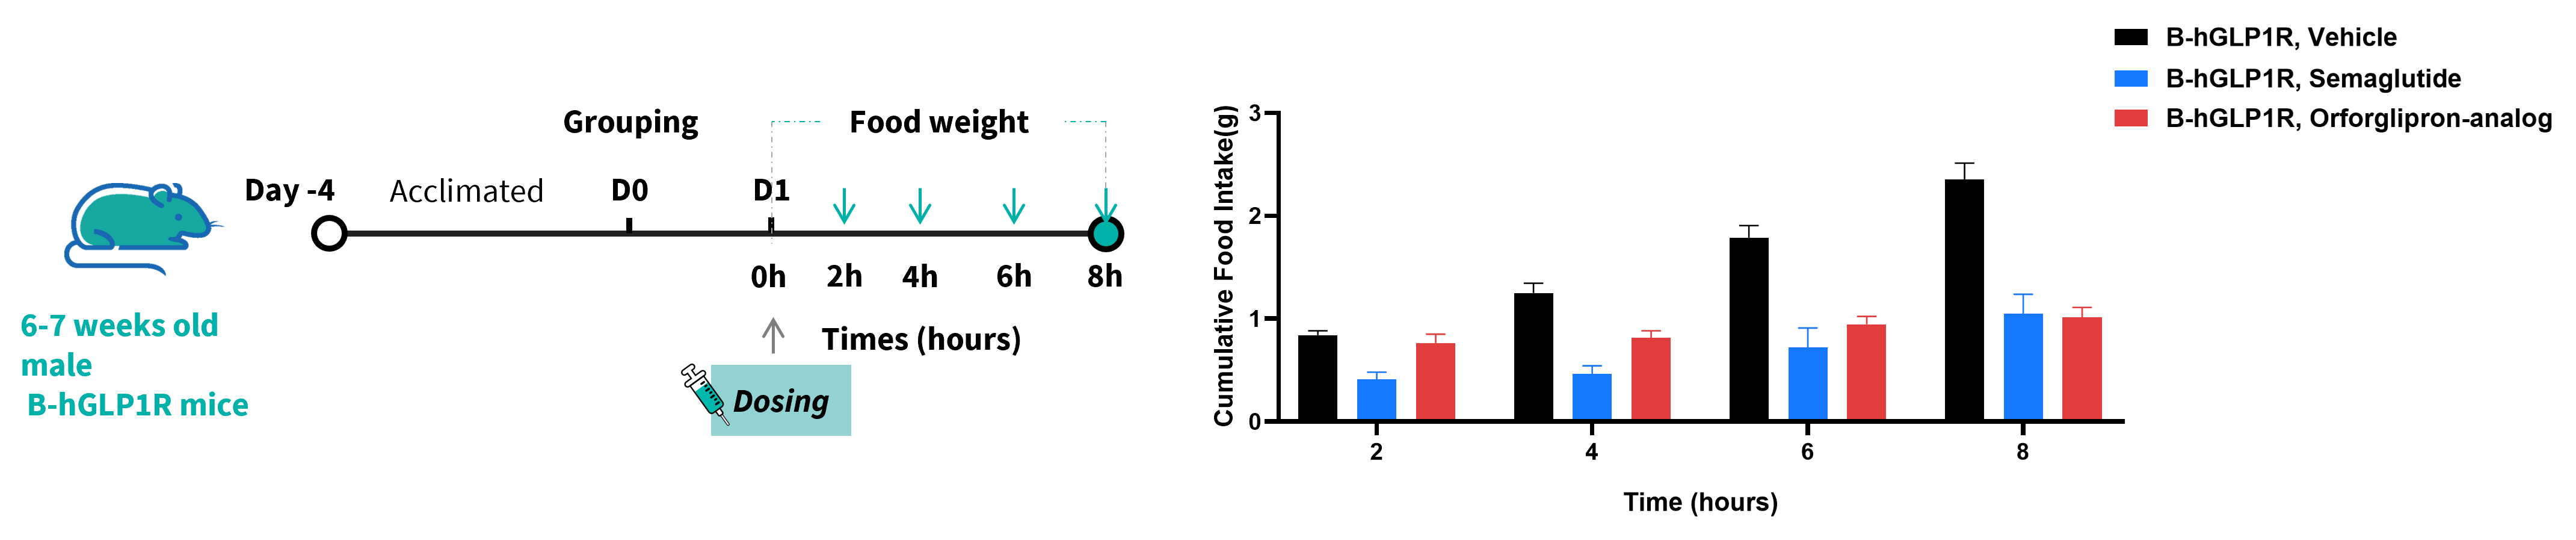
Food intake study of orforglipron and semaglutide in GLP1R humanized mice. GLP1R humanized mice (6–7 weeks old) were acclimated to once-daily oral dosing with vehicle for 4 days and then grouped based on body weight and daily food intake. Mice were fasted overnight and dosed with vehicle or test compound in the morning (before 10 AM). Food was returned 15 minutes post-dosing, and the remaining food was measured at 2, 4, 6, and 8 hours post-dosing. Values are presented as mean ± SEM.
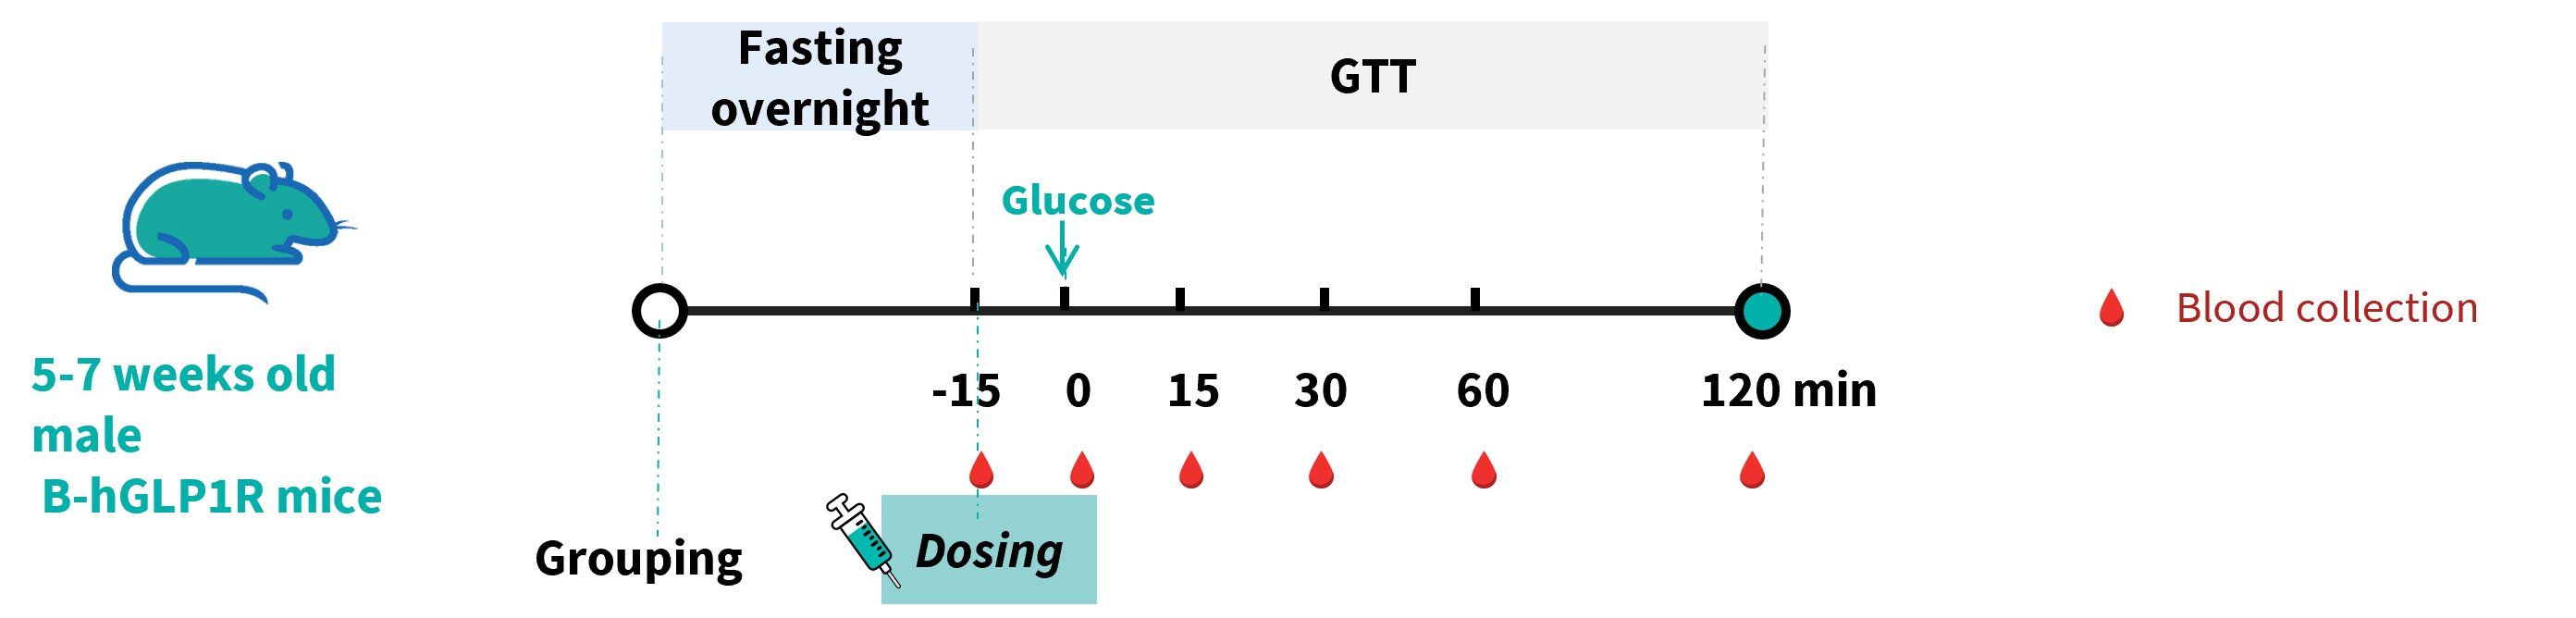
PF-06882961 improved glucose tolerance and promoted insulin secretion in GLP1R humanized mice. Wild-type C57BL/6JNifdc mice and GLP1R humanized mice (5–7 weeks old) were treated with PF-06882961 at 3 mg/kg. Then the Intraperitoneal Glucose Tolerance Test (IPGTT) was performed in C57BL/6JNifdc and GLP1R humanized mice for 2g/kg D-Glucose (20% Glucose, 10 μL/g).
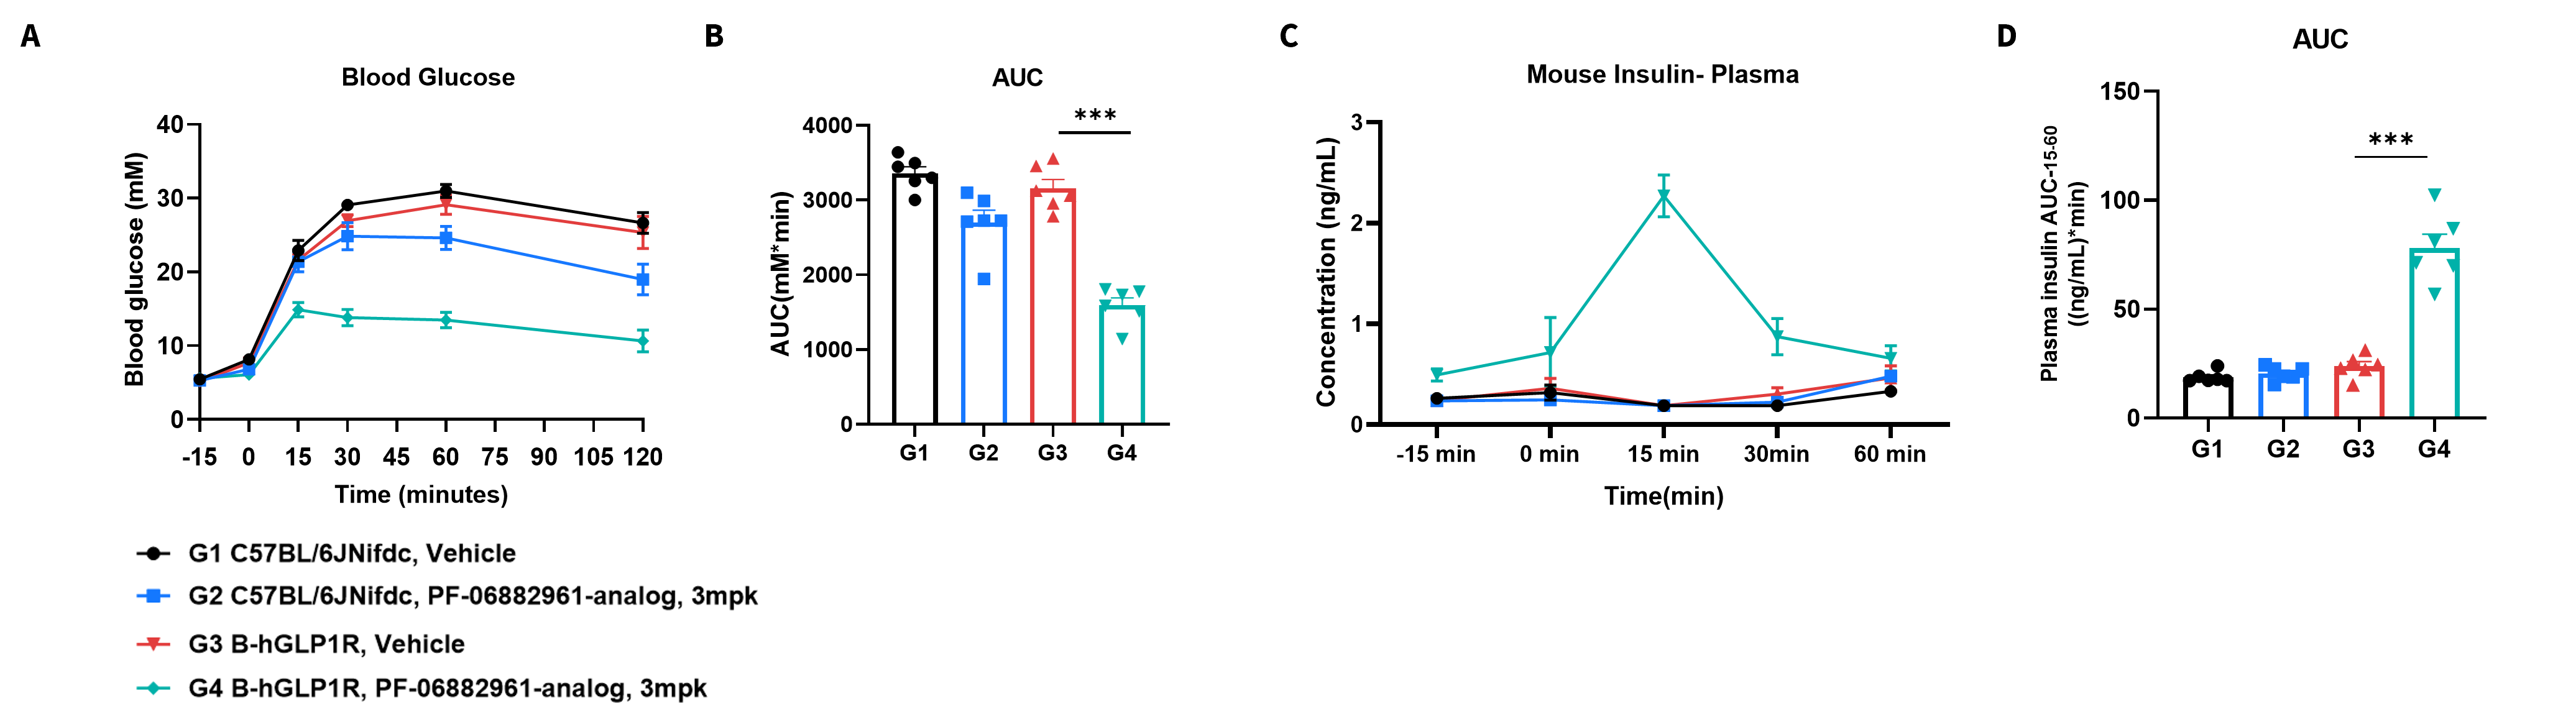
PF-06882961 improved glucose tolerance and promoted insulin secretion in GLP1R humanized mice. Wild-type C57BL/6JNifdc mice and GLP1R humanized mice(5–7 weeks old) were treated with PF-06882961 at 3 mg/kg. Then the IPGTT was performed in C57BL/6JNifdc and GLP1R humanized mice for 2g/kg D-Glucose (20% Glucose, 10 μL/g). (A) Blood glucose. (B) Area under the curve (AUC) for IPGTT. (C) Plasma insulin. (D) Area under the curve (AUC) for the plasma insulin. Values are expressed as mean ± SEM. Significance was determined by the unpaired t-test. (*P < 0.05, **P < 0.01, ***P < 0.001)
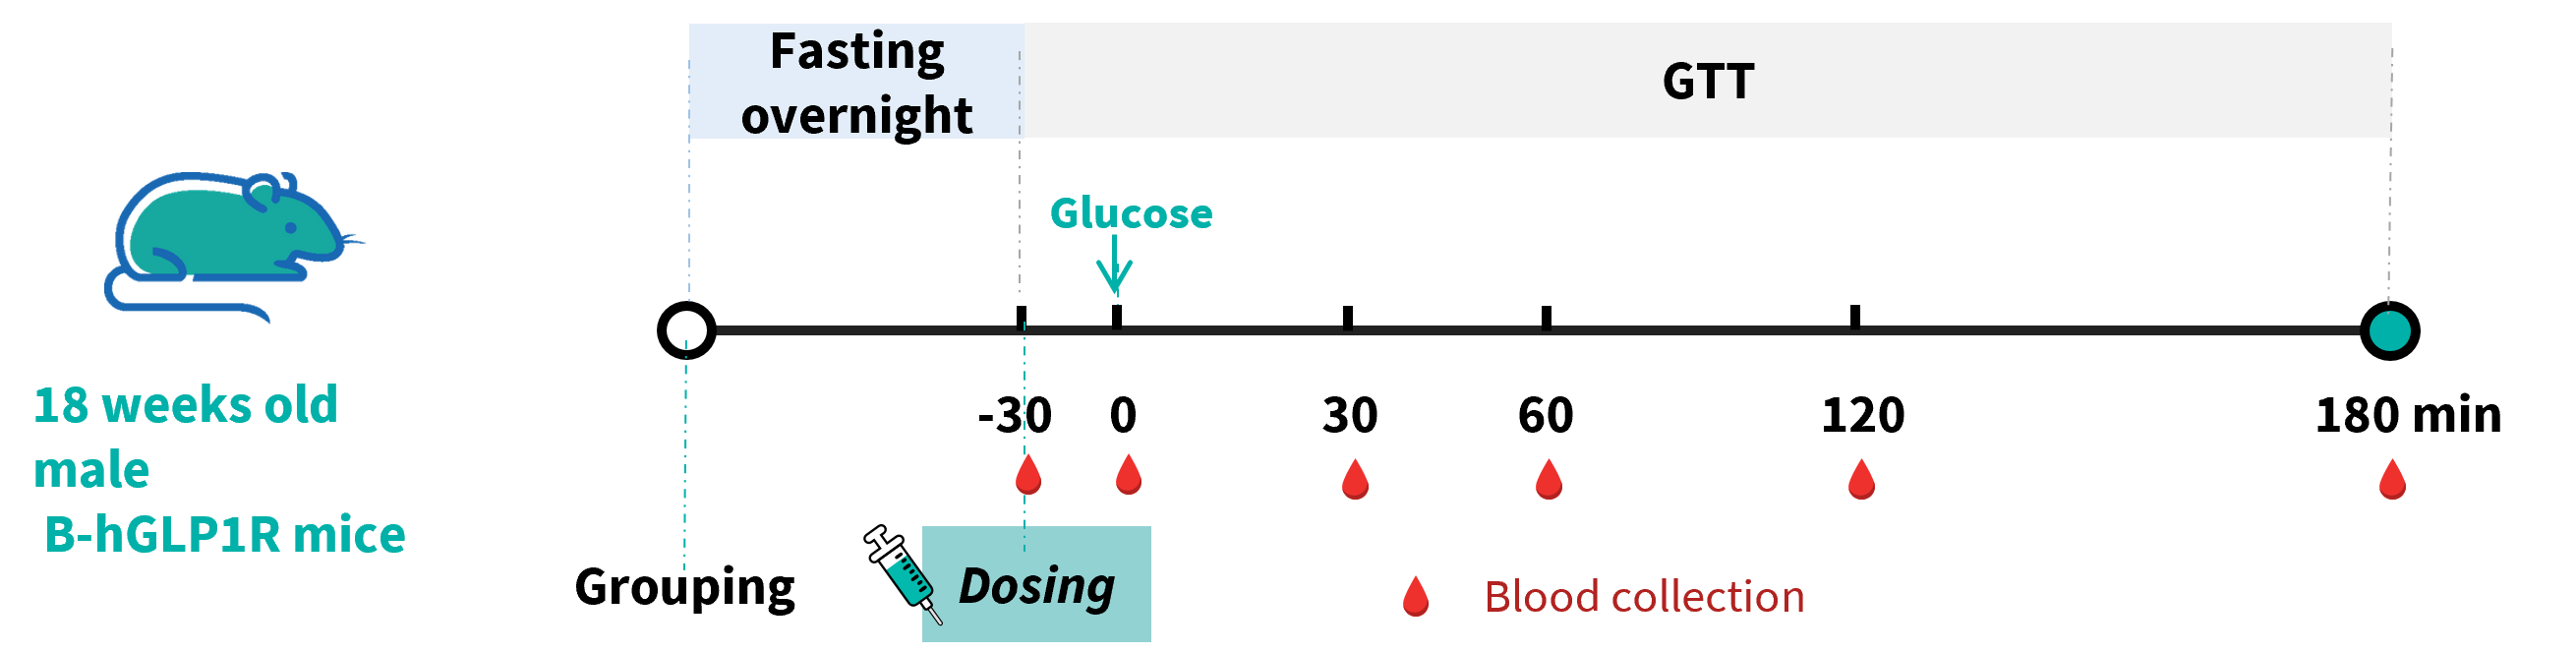
Orforglipron improved glucose tolerance and promoted insulin secretion in GLP1R humanized mice. Wild-type C57BL/6JNifdc mice and GLP1R humanized mice (18 weeks old) were treated with Orforglipron at 1 mg/kg. Then the Intraperitoneal Glucose Tolerance Test (IPGTT) was performed in C57BL/6JNifdc and GLP1R humanized mice for 2g/kg D-Glucose (40% Glucose, 5 μL/g).
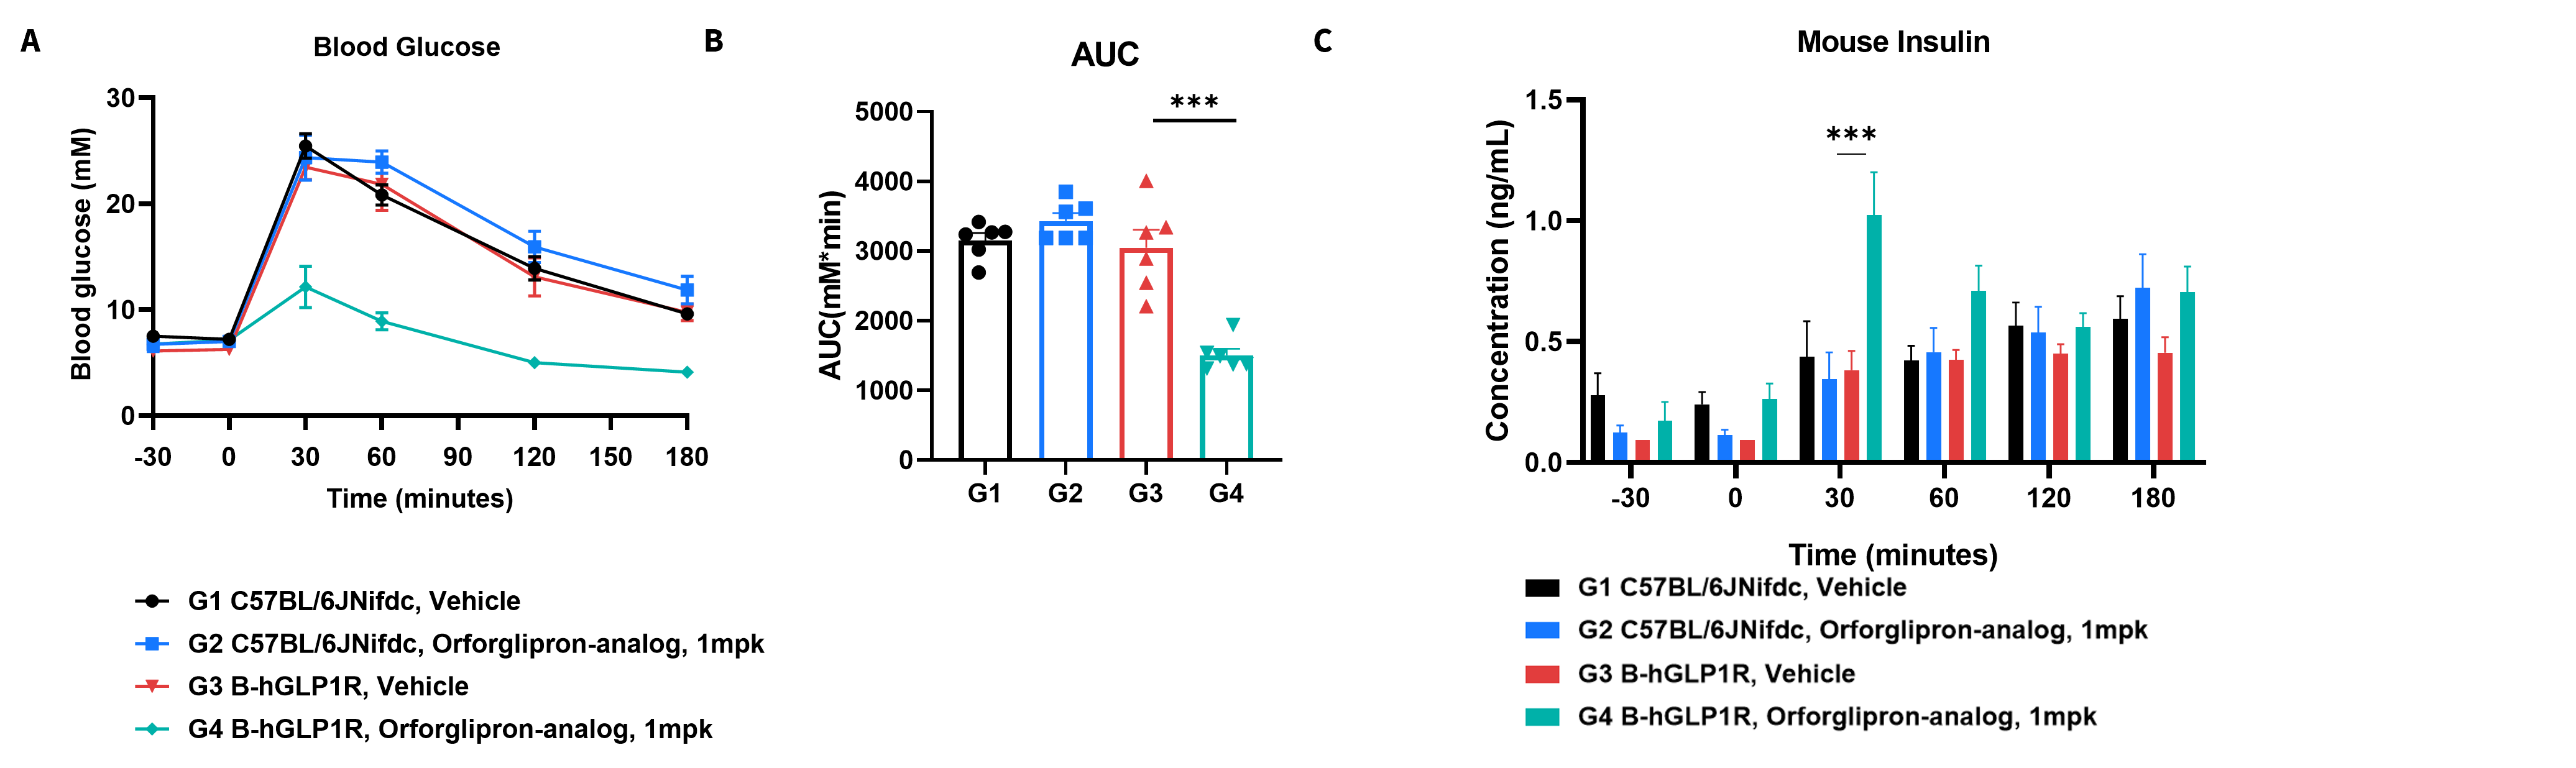
Orforglipron improved glucose tolerance and promoted insulin secretion in GLP1R humanized mice. Wild-type C57BL/6JNifdc mice and GLP1R humanized mice (18 weeks old) were treated with Orforglipron at 1 mg/kg. Then the IPGTT was performed in C57BL/6JNifdc and GLP1R humanized mice for 2g/kg D-Glucose (20% Glucose, 10 μL/g). (A) Blood glucose. (B) Area under the curve (AUC) for IPGTT. (C) Plasma insulin. Values are expressed as mean ± SEM. Significance was determined by the unpaired t-test. (*P < 0.05, **P < 0.01, ***P < 0.001)
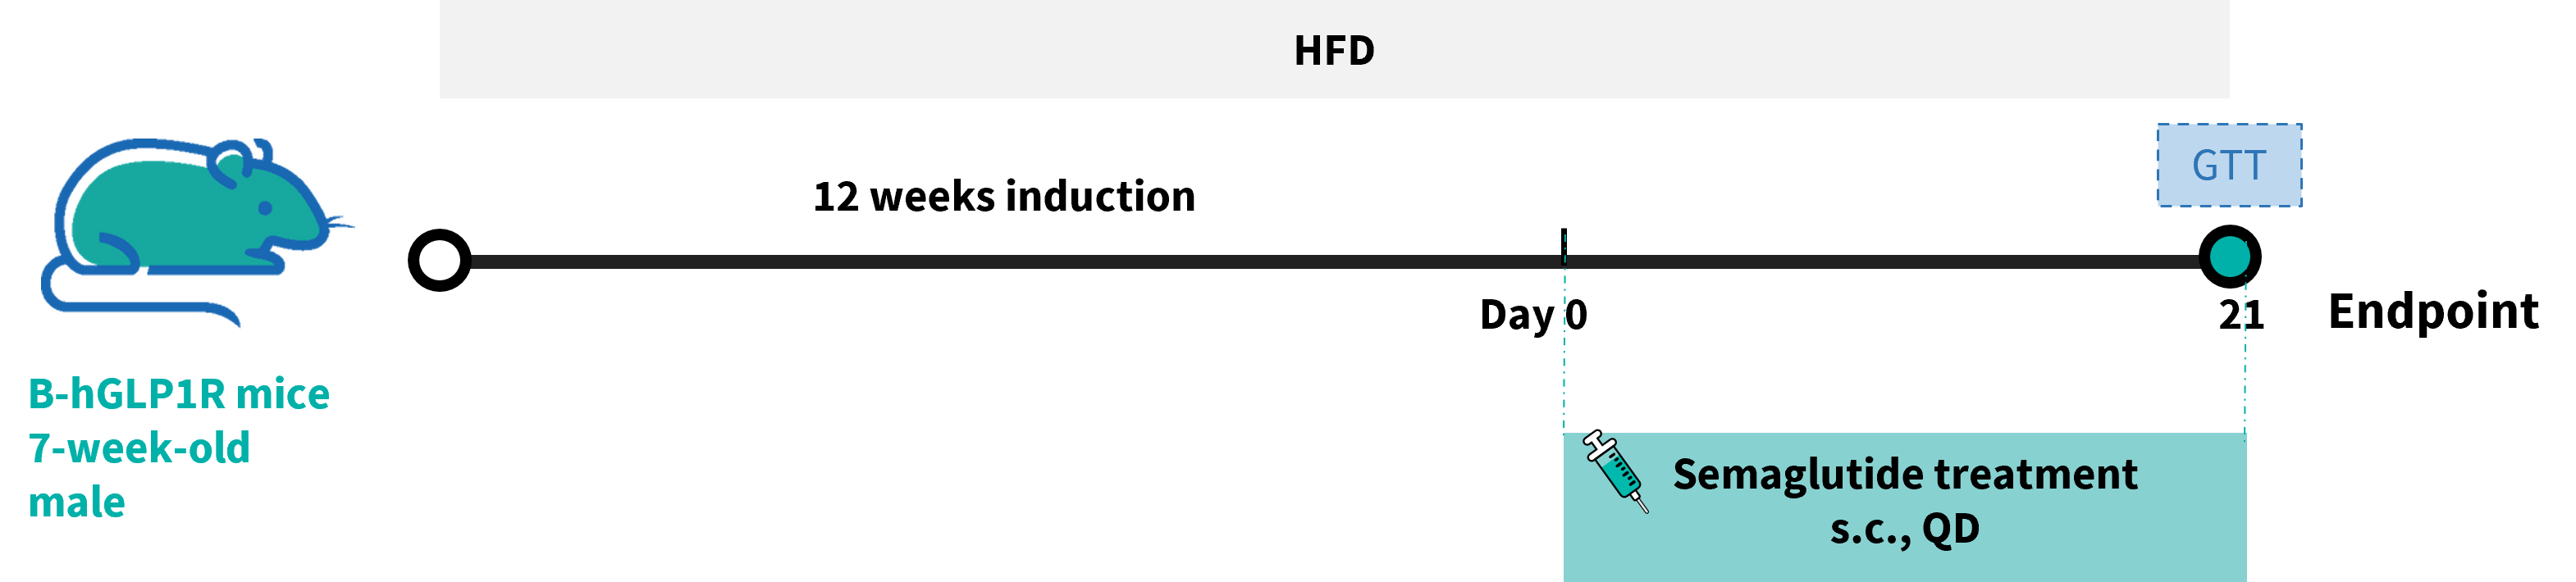
Efficacy of semaglutide in HFD-induced GLP1R humanized mice. GLP1R humanized mice were fed with a high-fat diet (HFD) for 12 weeks to induce obesity. Semaglutide and PBS were administered to the mice individually.
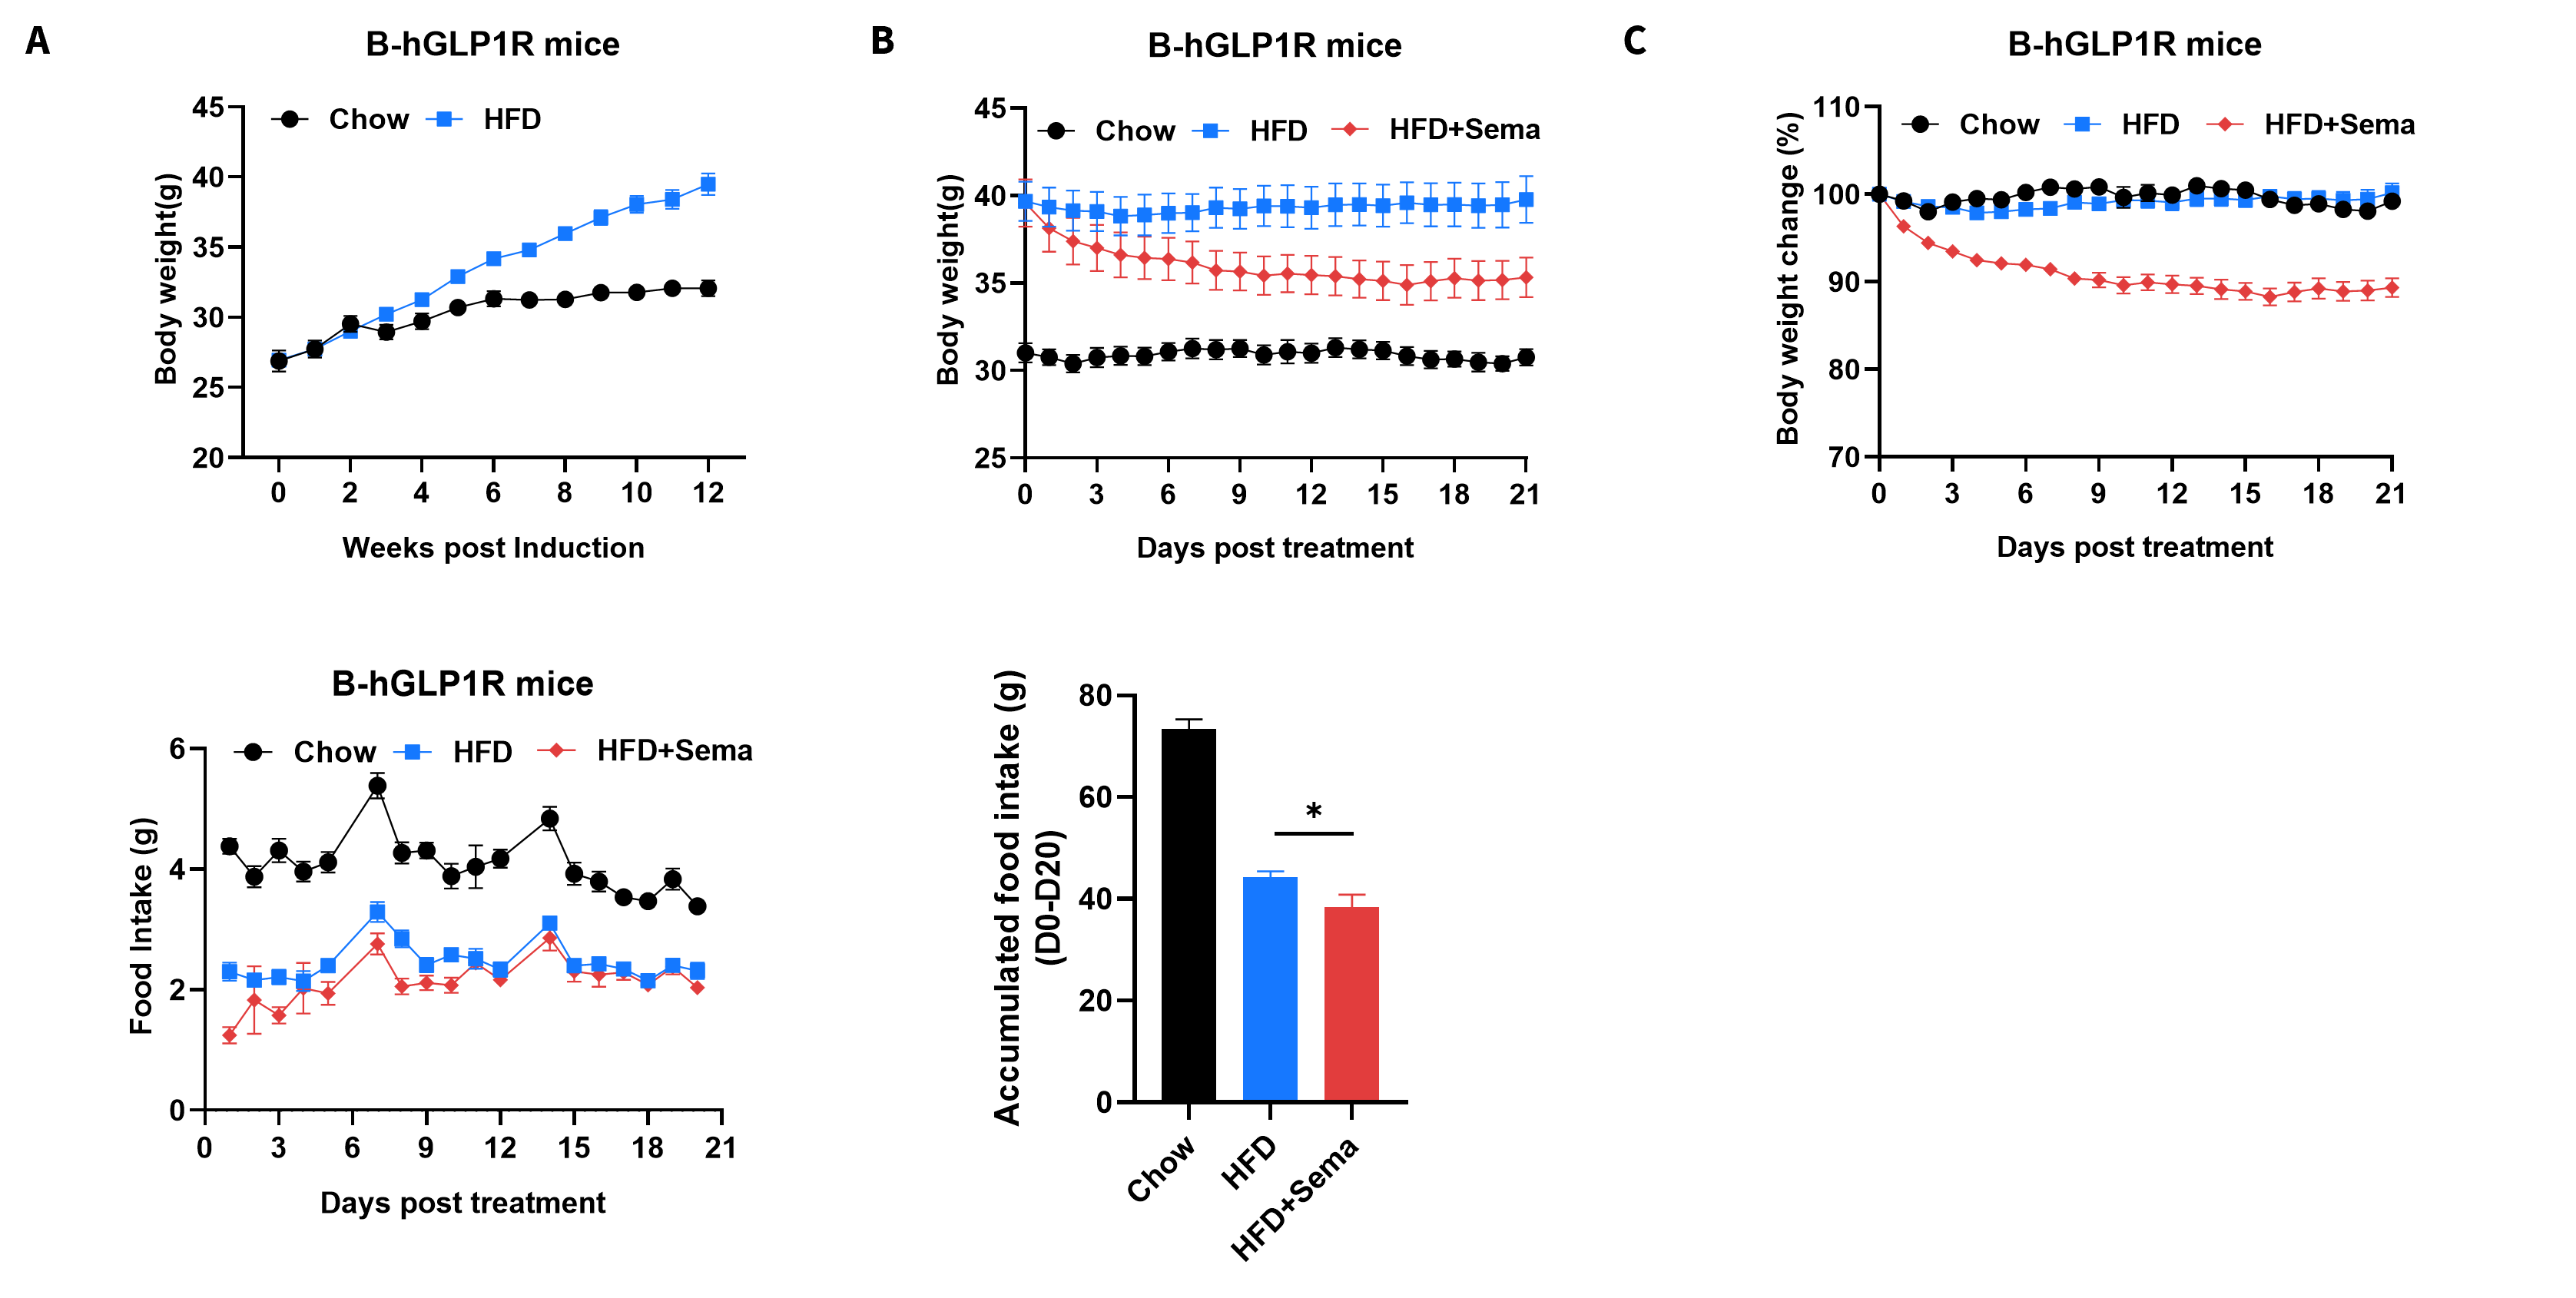
Efficacy of semaglutide in HFD-induced GLP1R humanized mice. GLP1R humanized mice were fed with a high-fat diet (HFD) for 12 weeks to induce obesity. (A) Body weight changes following HFD induction. (B–C) Body weight changes after semaglutide treatment. (D–E) Effects of semaglutide on food intake. 8–10 mice per group. Values are presented as mean ± SEM. Statistical significance was determined by ordinary one-way ANOVA.*p<0.05, **p<0.01,***p<0.001.
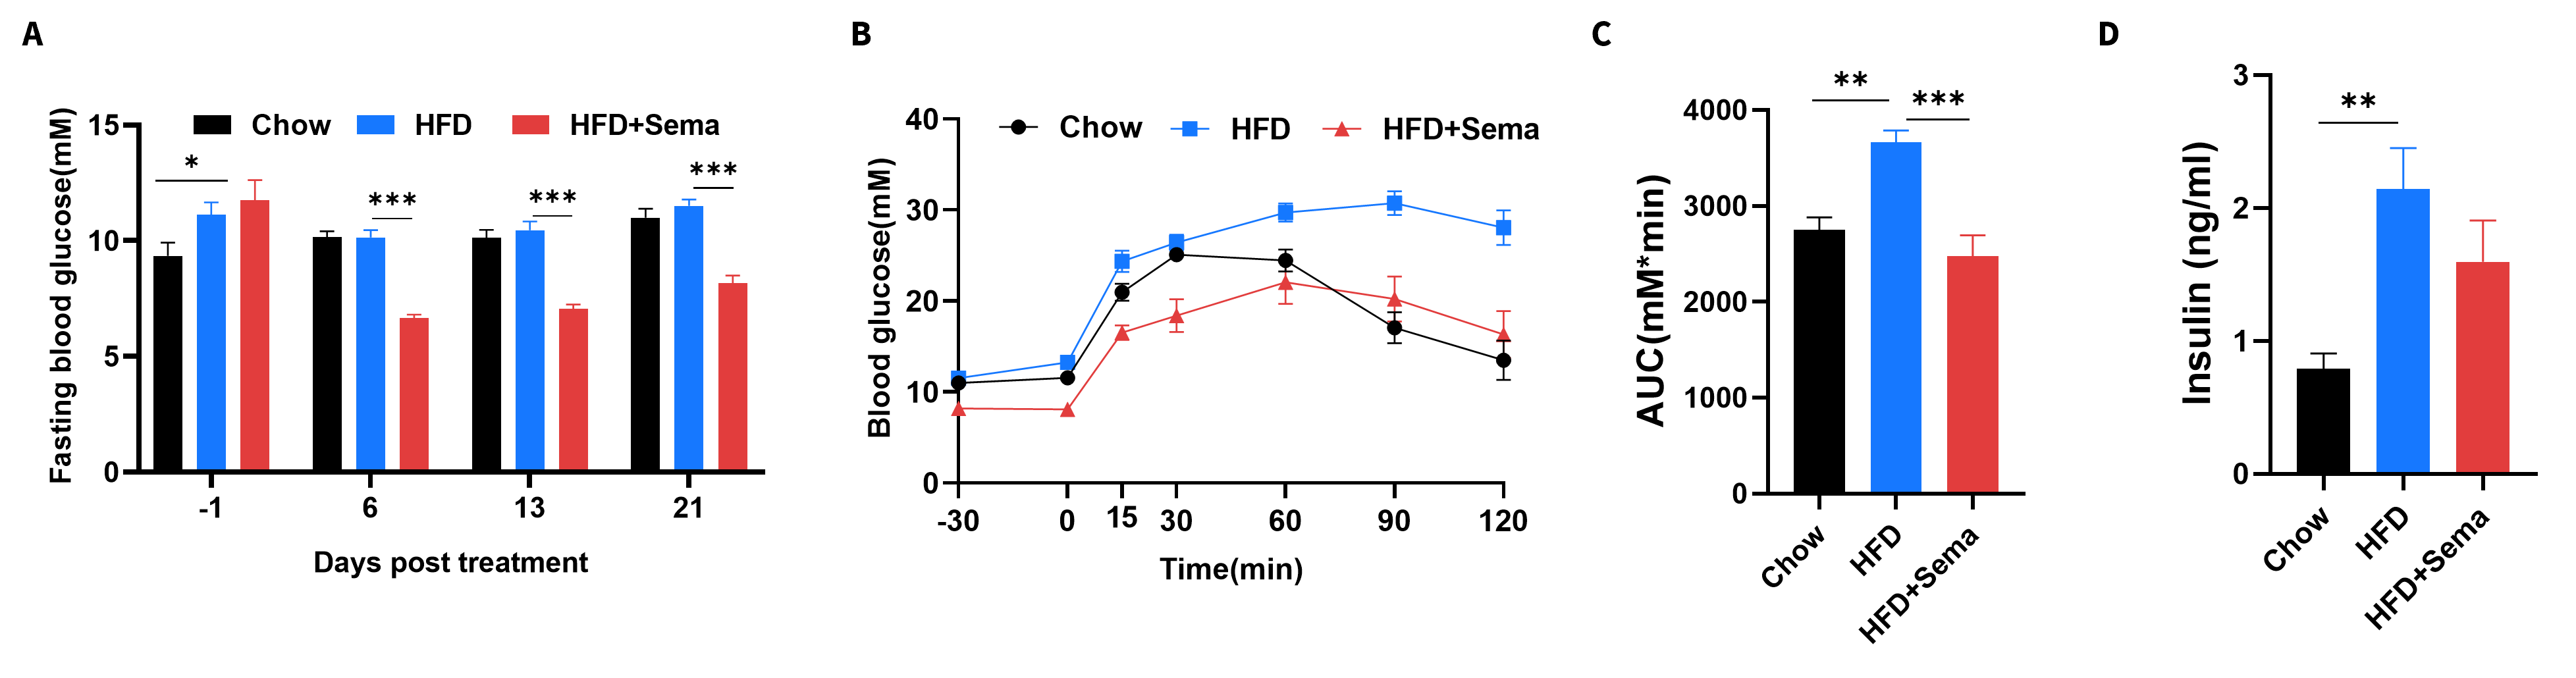
Efficacy of semaglutide in HFD-induced GLP1R humanized mice. (A) Blood glucose change after Semaglutide treatment. (B) Blood glucose for IPGTT. (C) Area under the curve (AUC) for the IPGTT. 8-10 mice per group. Values are expressed as mean ± SEM. Significance was determined by the Ordinary one-way ANOVA. *p<0.05, **p<0.01,***p<0.001.
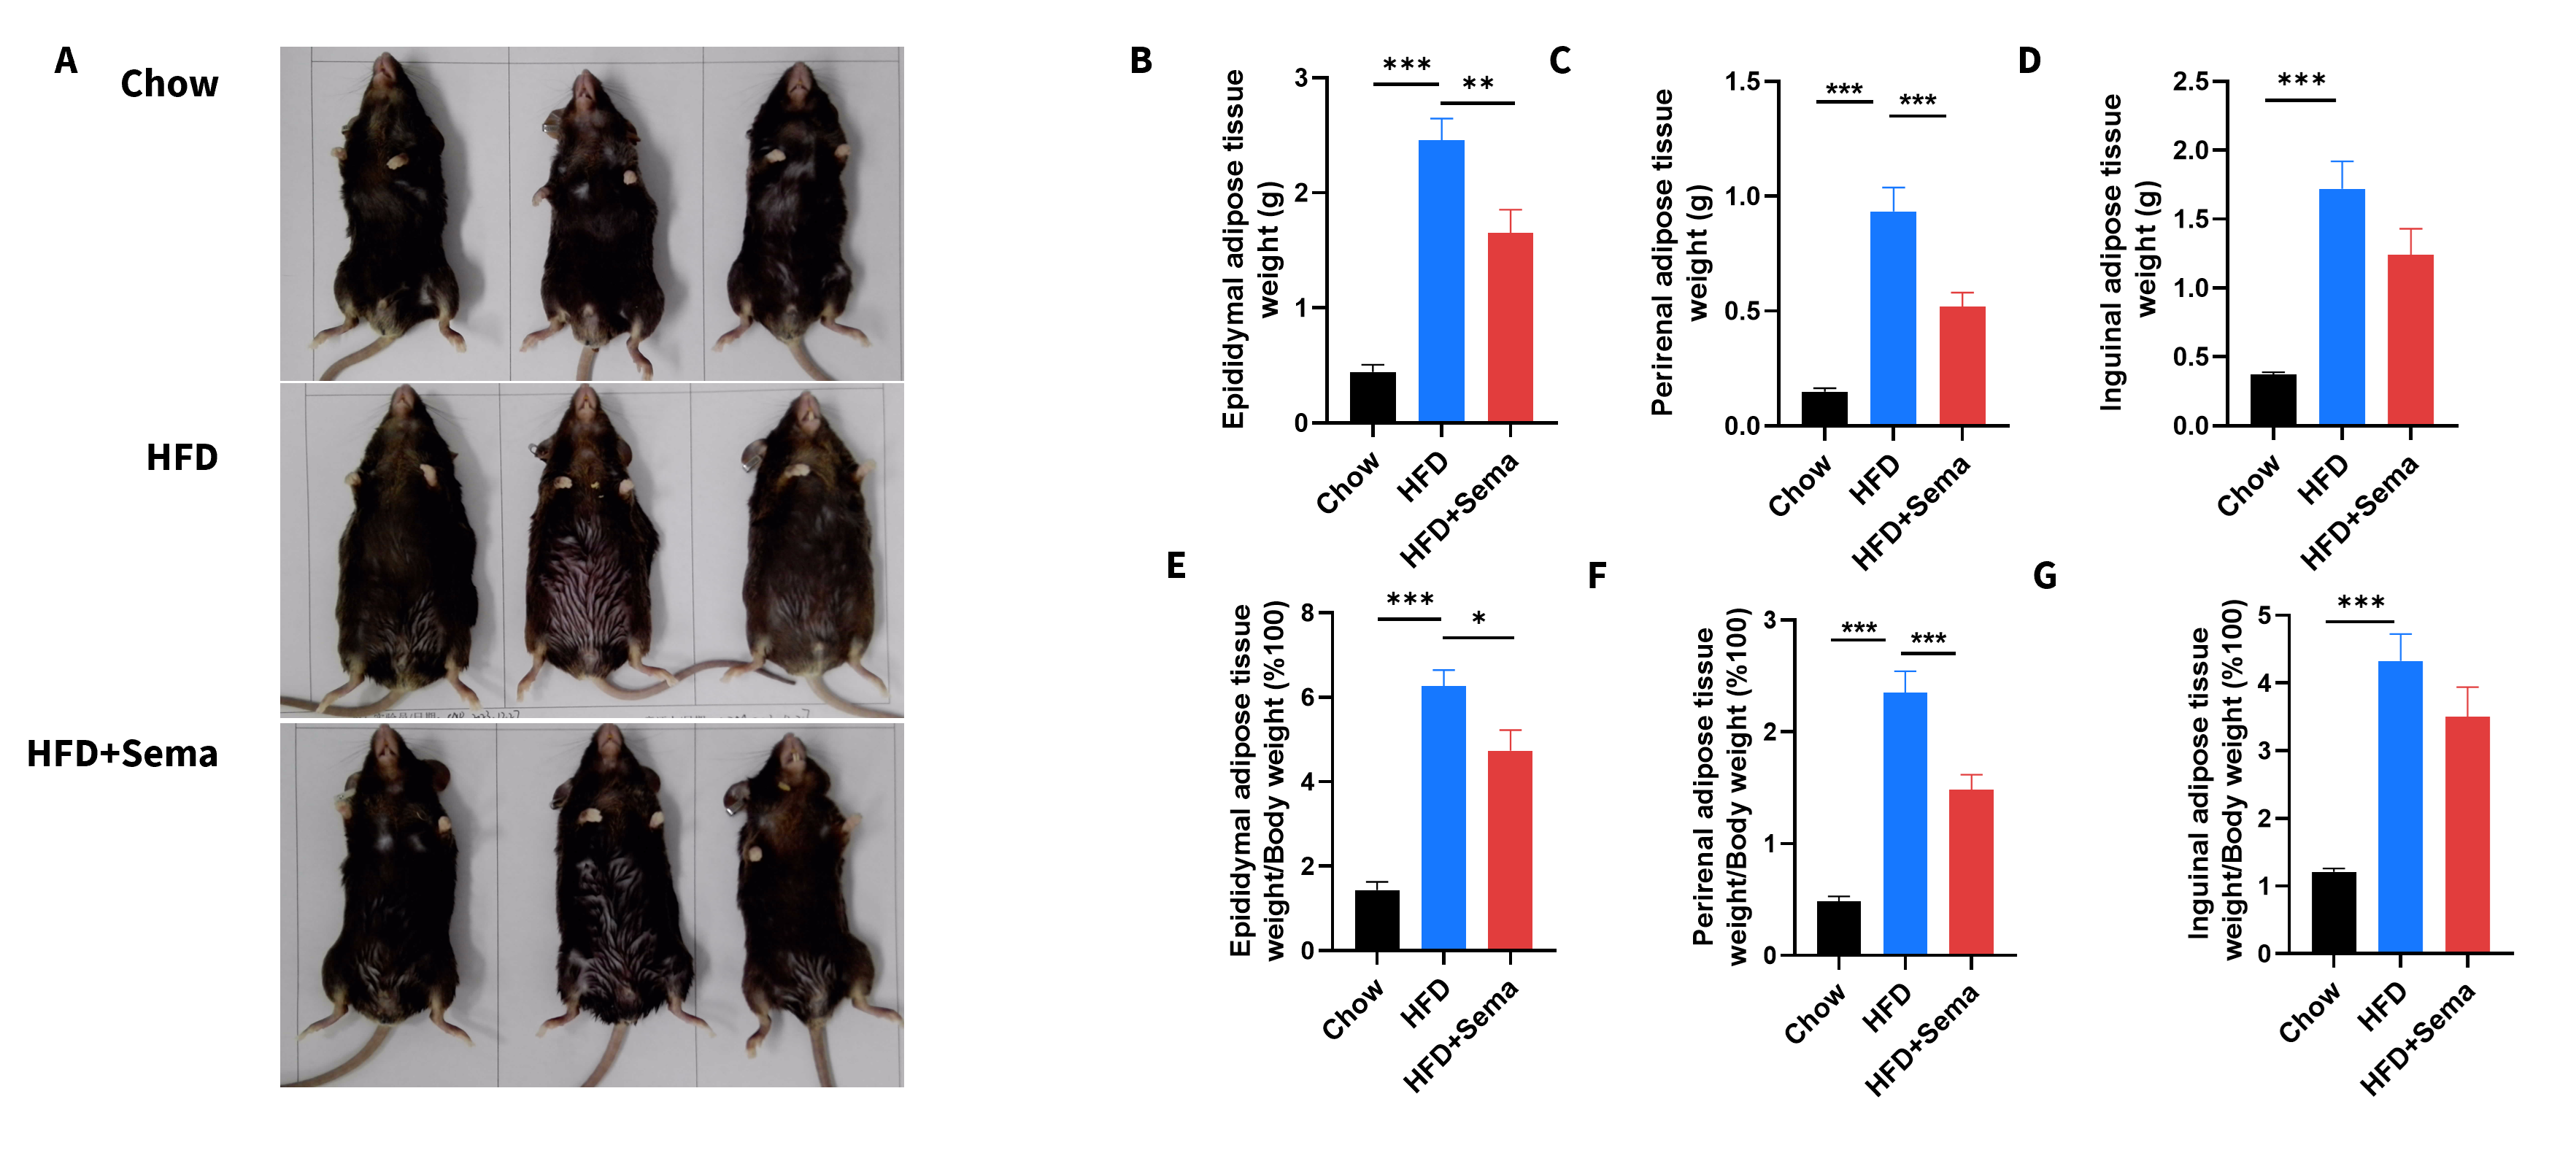
Efficacy of semaglutide in HFD-induced GLP1R humanized mice. (A) Representative pictures of different groups at termination. (B-D) Adipose tissue weights after treatment. (E-G) Ratios of adipose tissue weight and body weight. Data are expressed as mean ± SEM. Significance was determined by the Ordinary one-way ANOVA. *p<0.05, **p<0.01,***p<0.001.
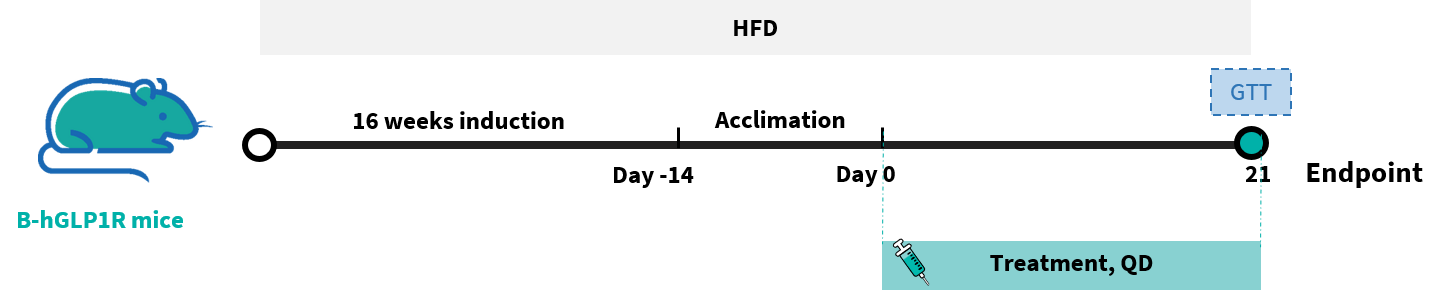
Efficacy of semaglutide and Orforglipron-analog in HFD-induced GLP1R humanized mice. GLP1R humanized mice were fed with a high-fat diet (HFD) for 16 weeks to induce obesity. Semaglutide, Orforglipron-analog (MCE), PBS, and Vehicle were administered to the mice individually.
Vehicle: 5% DMSO+ 10% Cremophor EL(BASF)+ 15% PEG400 + 70% 100 mM glycine-NaOH buffer (pH 10).
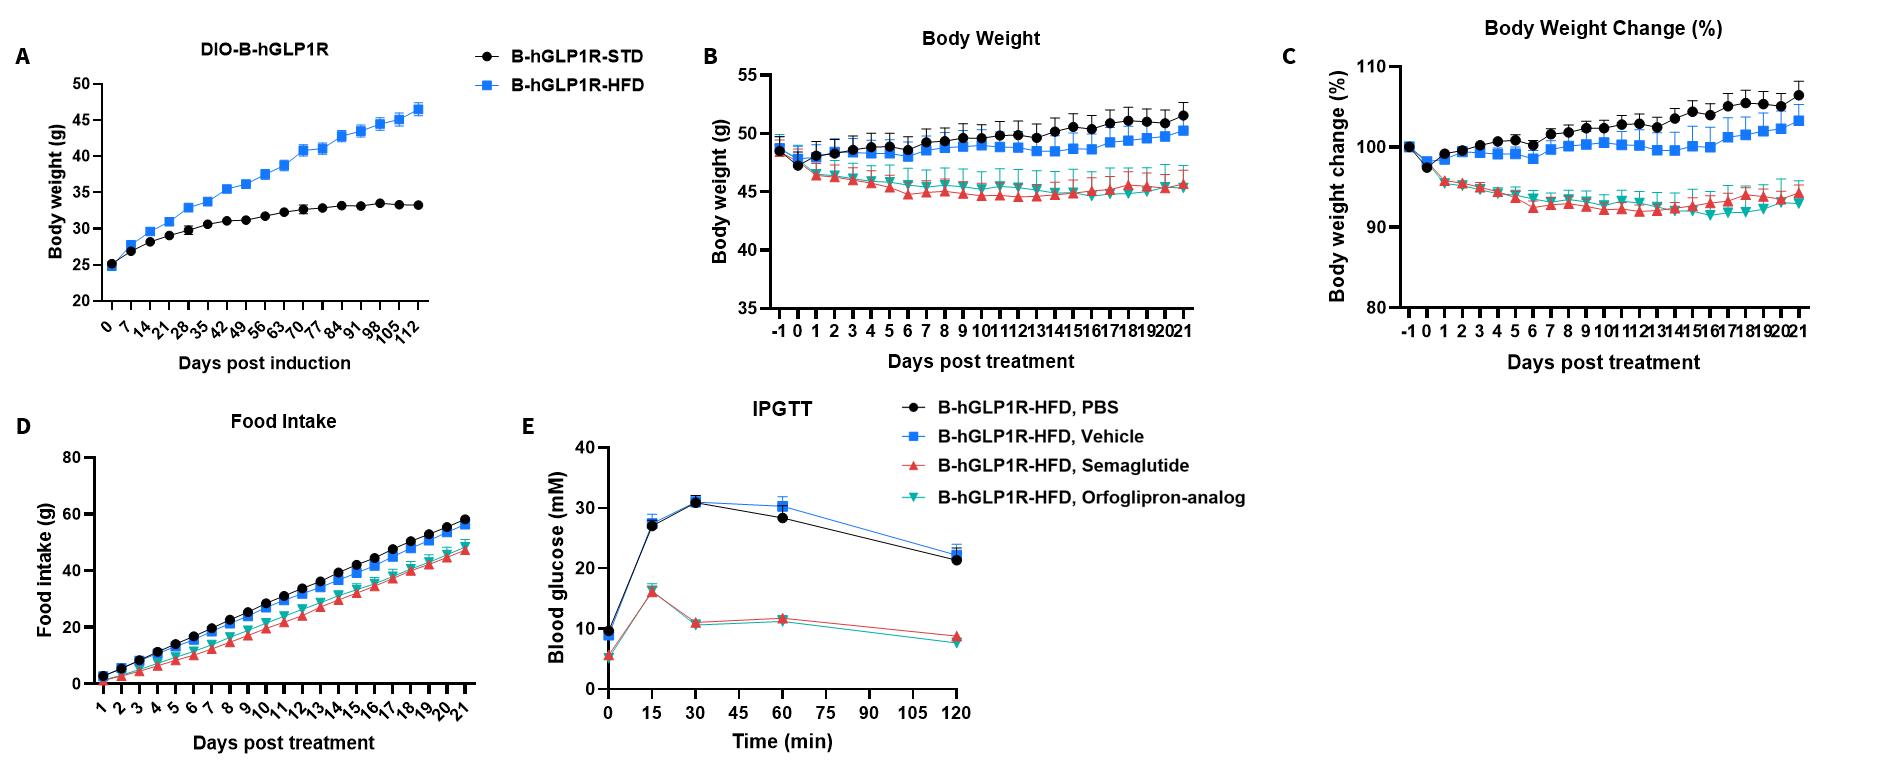
Efficacy of semaglutide and Orforglipron-analog in HFD-induced GLP1R humanized mice. GLP1R humanized mice were fed with a high-fat diet (HFD) for 16 weeks to induce obesity. Semaglutide, Orforglipron-analog (MCE), PBS, and Vehicle were administered to the mice individually. (A) Body weight changes following HFD induction. (B–C) Body weight changes after treatment. (D) Effects on food intake (E) Blood glucose for IPGTT. Values are presented as mean ± SEM.*p<0.05, **p<0.01,***p<0.001.

In vivo Efficacy in GLP1R humanized mice CDAA-HFD MASH Model. GLP1R humanized mice were fed a CDAA-HFD (the choline-deficient, 0.1% Methionine, 60% High-Fat Diet) to induce Metabolically Dysfunctional-Associated Steatohepatitis (MASH). Note: Data are shared upon the client's approval.
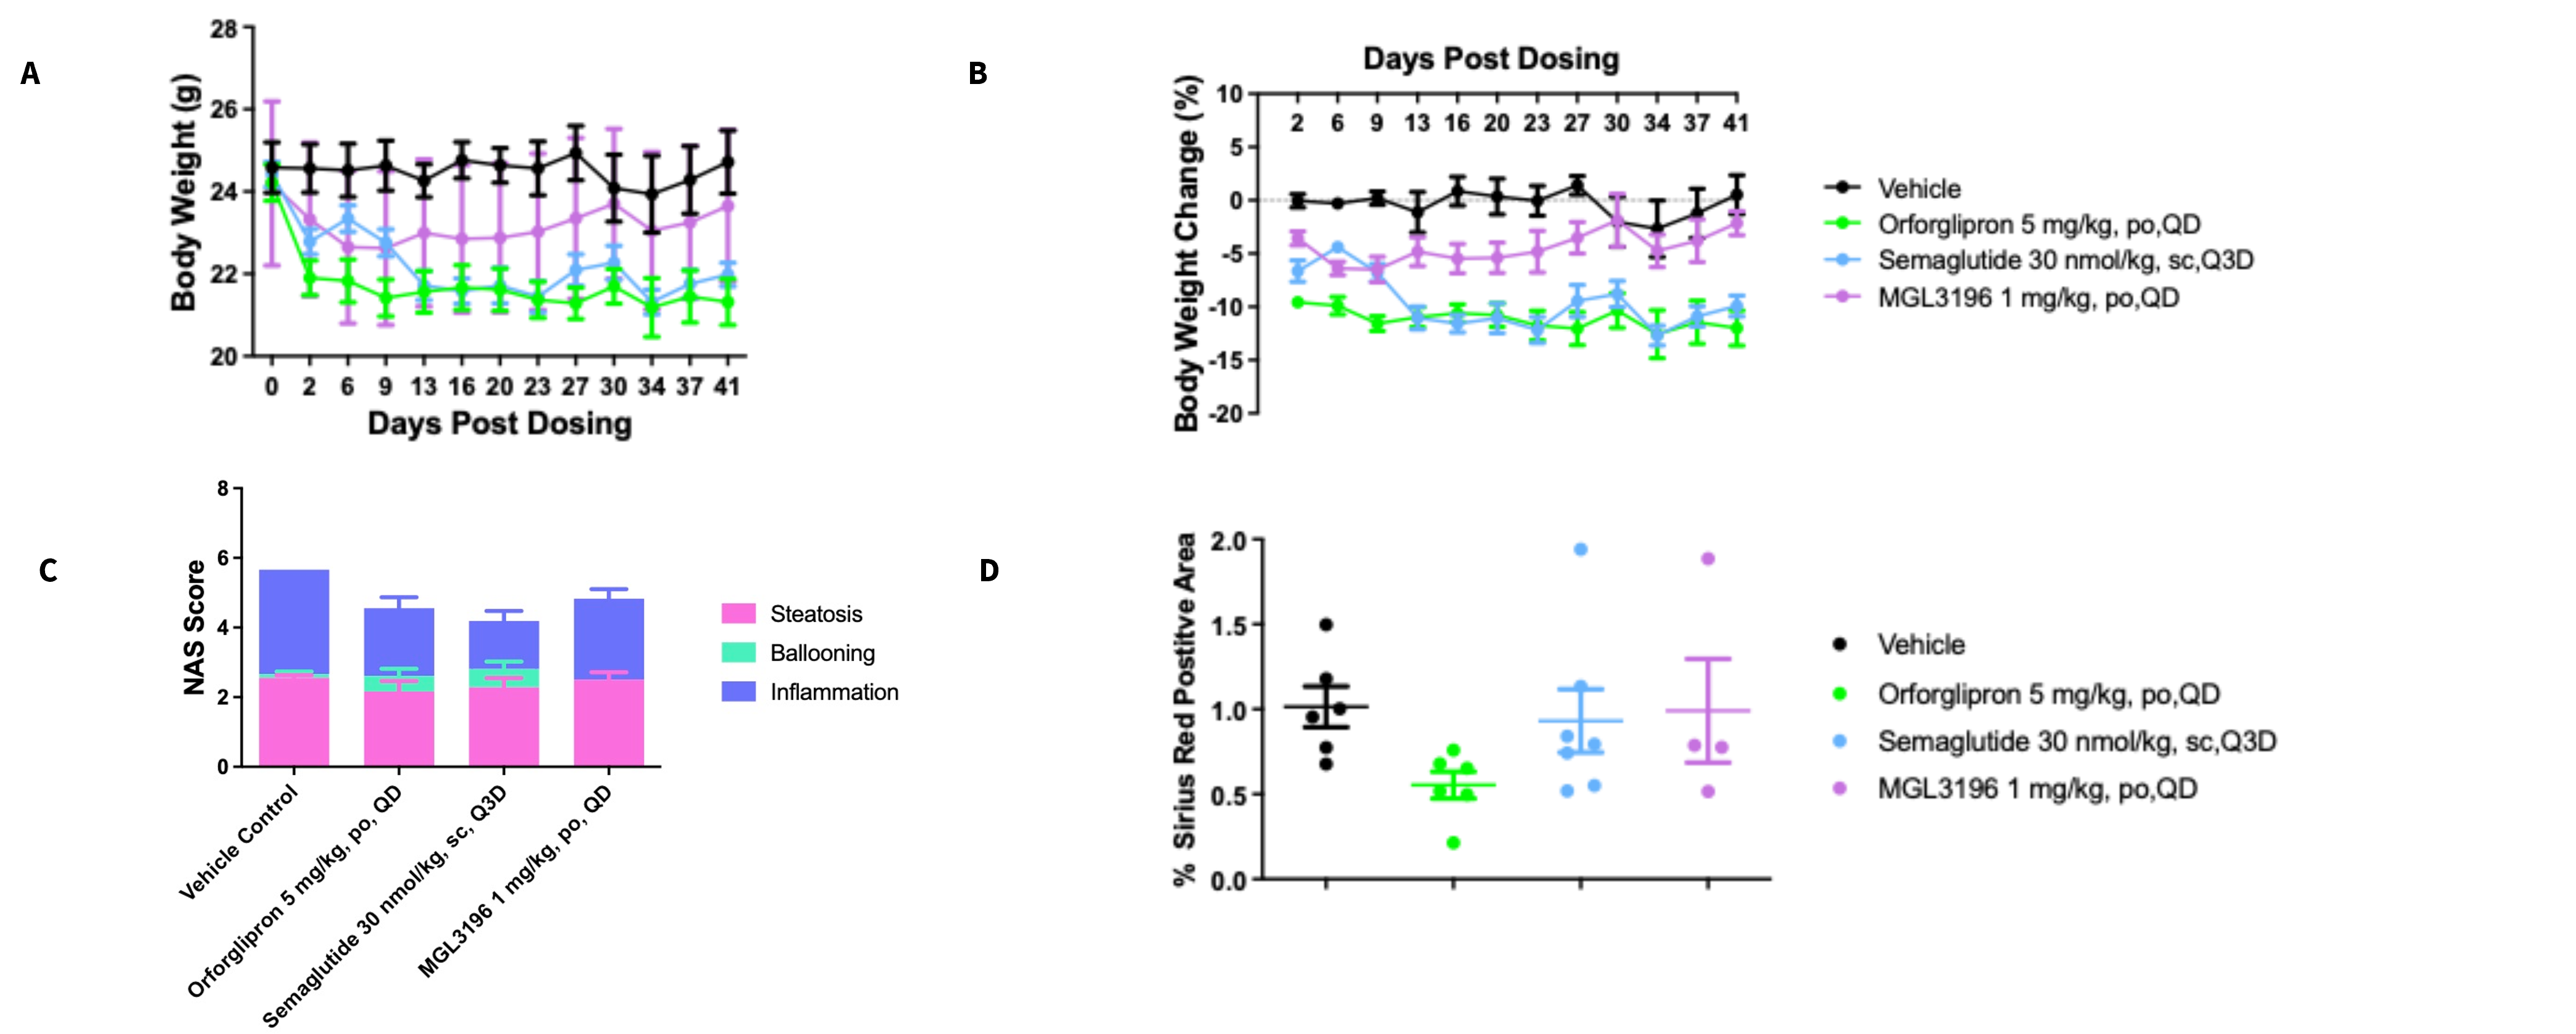
In vivo Efficacy in GLP1R humanized mice CDAA-HFD MASH Model. (A-B) Body weight changes after treatment. (C) Histological assessment of the NAFLD activity score (NAS). (D) Sirius Red Positive Area after treatment. Note: Data are shared upon the client's approval.