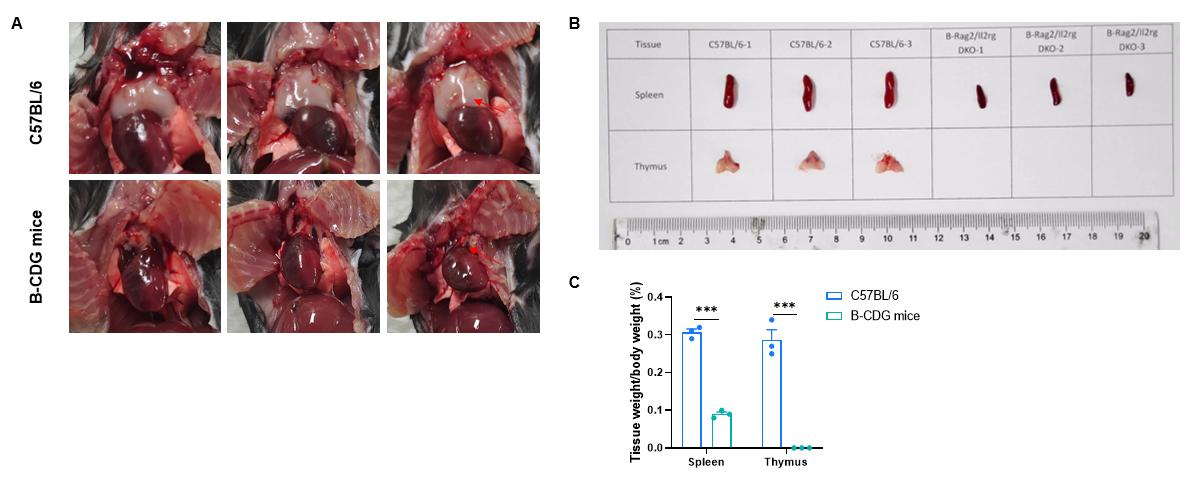
The size and weight of thymus and spleen significantly reduced in B-CDG mice
The size and weight of thymus and spleen of B-CDG mice were significantly reduced compared to that of wild-type C57BL/6 mice. Thymuses and spleens were isolated from wild-type C57BL/6 mice and B-CDG mice (n=3, 7-week-old). A. Gross anatomy of thymuses; B. The size of spleen and thymus; C. Comparison of organ coefficients of spleen and thymus in wild-type C57BL/6 mice and B-CDG mice. Results showed that thymuses were not visualized in B-CDG mice. The size and weight of spleens in B-CDG mice were significantly reduced compared to that in wild-type C57BL/6 mice.
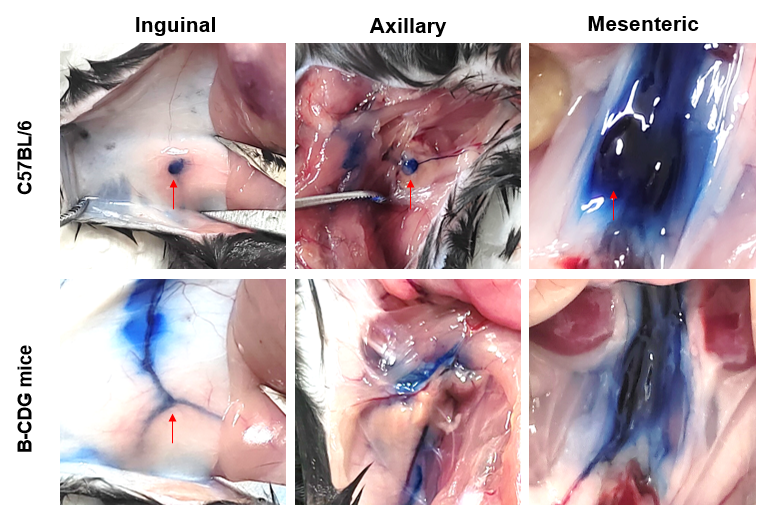
Evans blue staining of lymph nodes
Lymph nodes were not visualized in B-CDG mice dyed by Evans blue. Wild-type C57BL/6 mice and B-CDG mice (n=3) were sacrificed and intravenously injected with 10% Evens blue in the planta pedis. The red arrows indicate the lymph nodes in inguinal, axillary and mesenteric site of the mice. No lymph node was visualized in B-CDG mice.
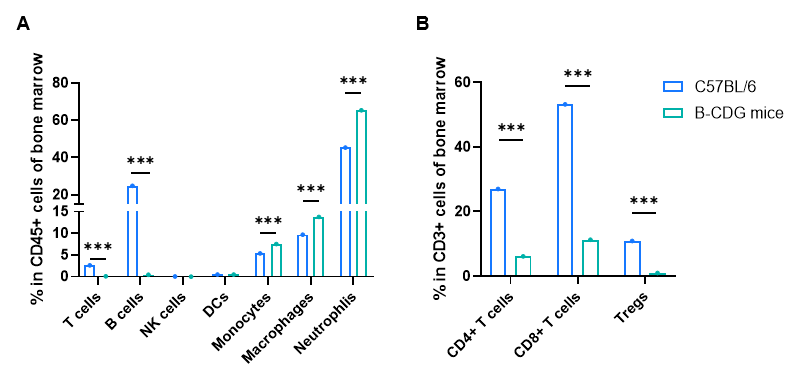
Frequency of leukocyte subpopulations in bone marrow
Frequency of leukocyte subpopulations in bone marrow by flow cytometry. Bone marrow cells were isolated from male wild-type C57BL/6 mice and homozygous B-CDG mice (n=3, 6-week-old). A. Flow cytometry analysis of the bone marrow cells was performed to assess the frequency of leukocyte subpopulations. B. Frequency of T cell subpopulations. T cells, including CD4+ T cells, CD8+ T cells and Tregs, B cells and NK cells were not detectable in B-CDG mice. Frequency of neutrophils, monocytes and macrophages were increased in B-CDG mice compared to that in C57BL/6 mice, demonstrating that the development of T cells, B cells and NK cells in bone marrow were completely inhibited in B-CDG mice. Values are expressed as mean ± SEM. Significance was determined by two-way ANOVA test. *P < 0.05, **P < 0.01, ***p < 0.001.
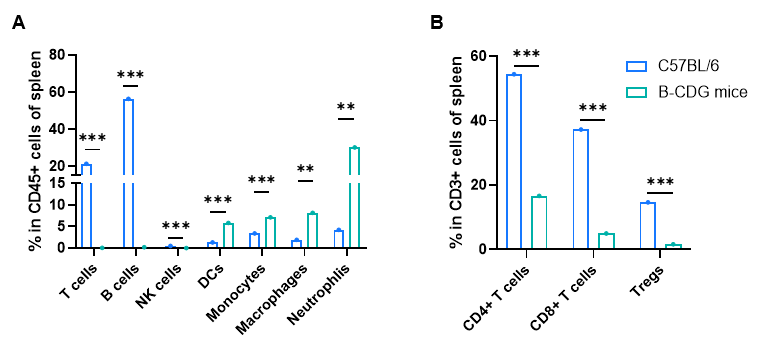
Frequency of leukocyte subpopulations in spleen
Frequency of leukocyte subpopulations in spleen by flow cytometry. Splenocytes were isolated from male wild-type C57BL/6 mice and homozygous B-CDG mice (n=3, 6-week-old). A. Flow cytometry analysis of the splenocytes was performed to assess the frequency of leukocyte subpopulations. B. Frequency of T cell subpopulations. T cells, including CD4+ T cells, CD8+ T cells and Tregs, B cells and NK cells were not detectable in B-CDG mice. Frequency of dendritic cells, neutrophils, monocytes and macrophages were increased in B-CDG mice compared to that in C57BL/6 mice, demonstrating that the development of T cells, B cells and NK cells in spleen were completely inhibited in B-CDG mice. Values are expressed as mean ± SEM. Significance was determined by two-way ANOVA test. *P < 0.05, **P < 0.01, ***p < 0.001.
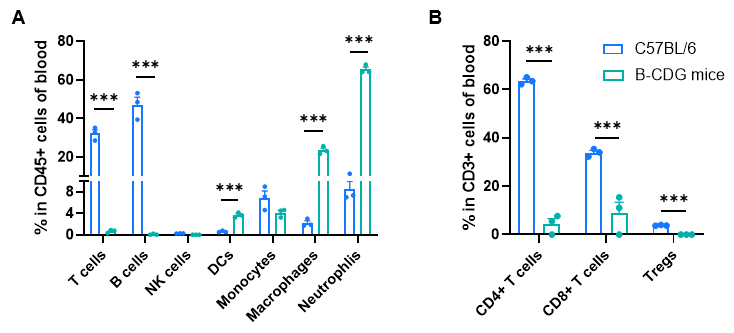
Frequency of leukocyte subpopulations in blood
Frequency of leukocyte subpopulations in blood by flow cytometry. Blood cells were isolated from male wild-type C57BL/6 mice and homozygous B-CDG mice (n=3, 6-week-old). A. Flow cytometry analysis of the splenocytes was performed to assess the frequency of leukocyte subpopulations. B. Frequency of T cell subpopulations. T cells, including CD4+ T cells, CD8+ T cells and Tregs, B cells and NK cells were not detectable in B-CDG mice. Frequency of dendritic cells, neutrophils and macrophages were increased in B-CDG mice compared to that in C57BL/6 mice, demonstrating that the development of T cells, B cells and NK cells in blood were completely inhibited in B-CDG mice. Values are expressed as mean ± SEM. Significance was determined by two-way ANOVA test. *P < 0.05, **P < 0.01, ***p < 0.001.
B-CDG mice are More Tolerant to High-dose X-ray Irradiation than B-NDG mice
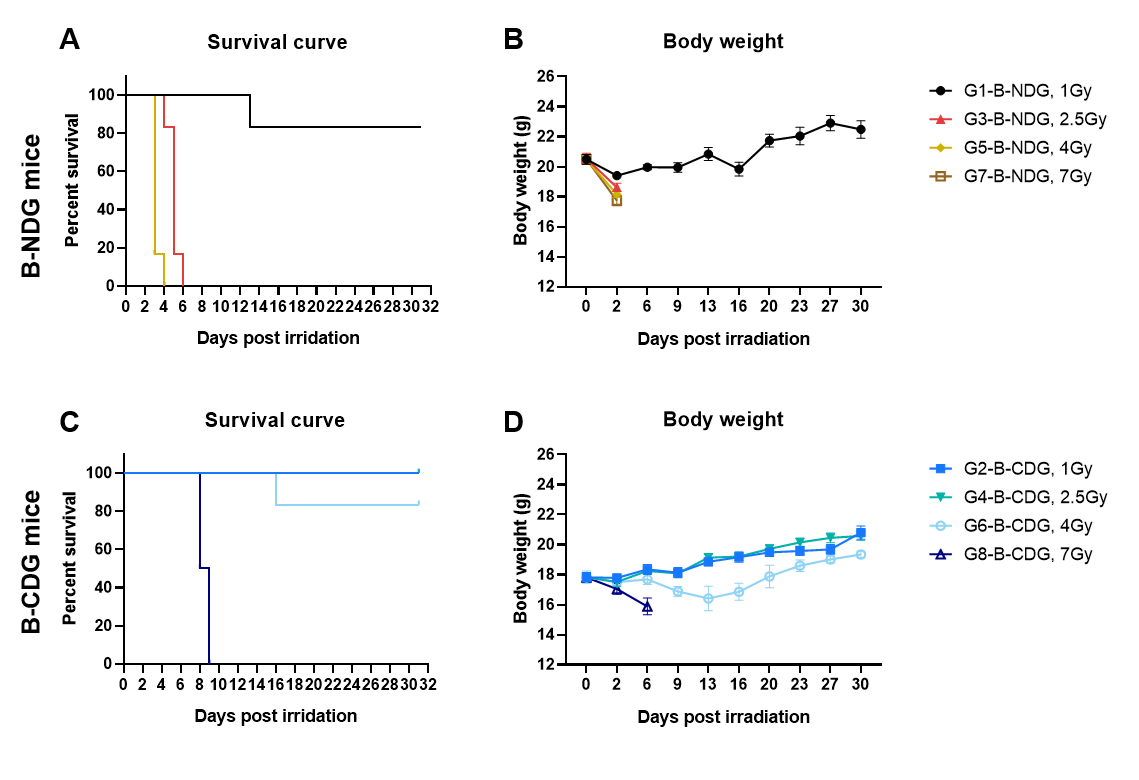
Comparison of the irradiation tolerance of B-CDG mice and B-NDG mice by using different doses of X-rays. B-NDG mice and B-CDG mice were exposed to graded X-ray doses; survival and body weight were monitored up to 30 days post-irradiation. (A-B) Survival rate and body weight change of B-NDG mice. (C-D) Survival rate and body weight change of B-CDG mice. When the irradiation dose reached 2.5 Gy or more, all of B-NDG mice died 2 days after irradiation. Only 1/6 of the B-NDG mice could survive until 30 days after irradiation at a dose of 1 Gy. All B-CDG mice survived until 30 days when the irradiation dose was 2.5 Gy; some of them could survive until 30 days when the irradiation dose was 4 Gy; and all B-CDG mice died 9 days after irradiation when the dose was 7 Gy. Across comparable doses, B-CDG mice demonstrate substantially greater whole-body irradiation tolerance than B-NDG mice. Values are expressed as mean ± SEM.
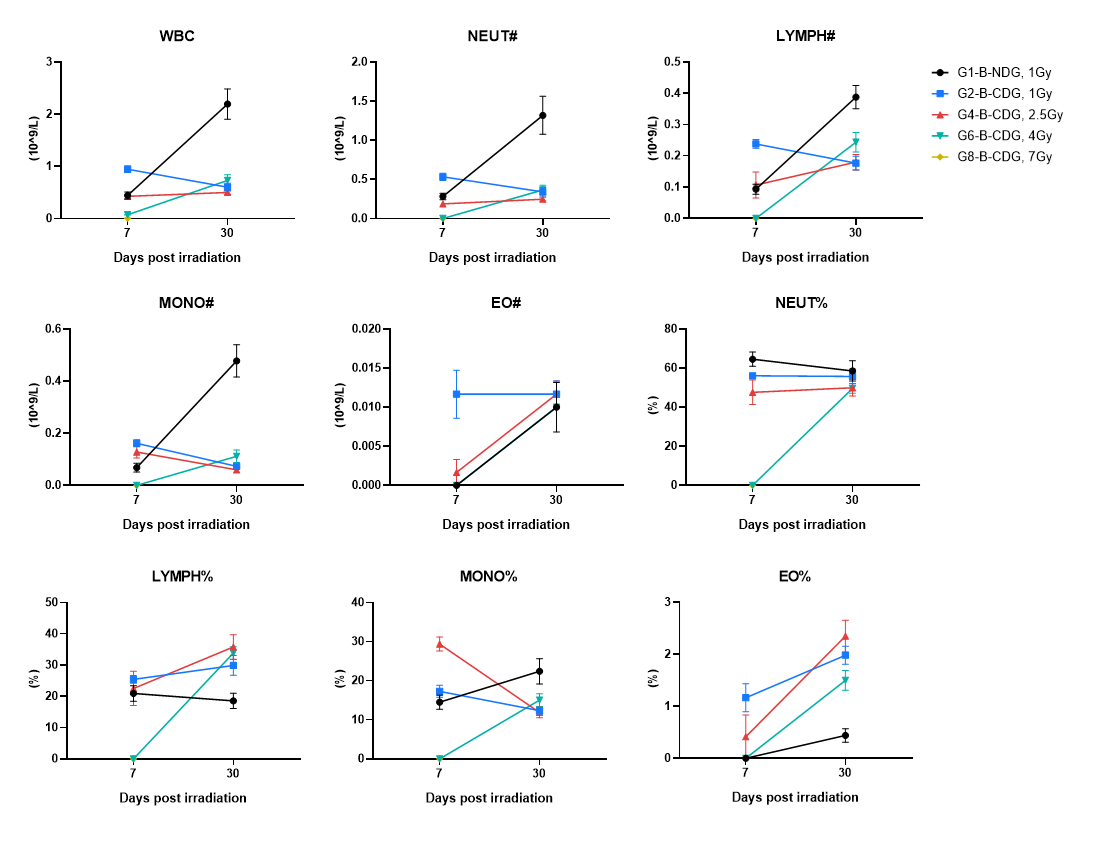
White Blood Cell (WBC) Dynamics: Delayed Leukocyte Recovery in B-CDG mice
Complete Blood Count (CBC) was measured at day 7 and day 30 post-irradiation. Blood were collected on the indicated days and tested by CBC. Across groups, WBC and differential metrics showed post-irradiation suppression with partial recovery by day 30. B-CDG mice had not recovered by day 30 and exhibited slower WBC recovery. Values are expressed as mean ± SEM.
Red Blood Cell (RBC) & Erythropoiesis: Dose-dependent Suppression with Recovery by Day 30
RBC indices and erythropoiesis markers were quantified at day 7 and day 30 post-irradiation. Blood were collected on the indicated days and tested by CBC. The results showed that there was a clear dose-dependent impact on RBC parameters, with high-dose groups showing reduced RBC and erythropoietic capacity at day 7, followed by substantial recovery by day 30 (high-dose groups recover more slowly). Irradiation induced transient anemia/erythropoietic suppression that largely normalized by day 30, with slower normalization at higher doses. Values are expressed as mean ± SEM.
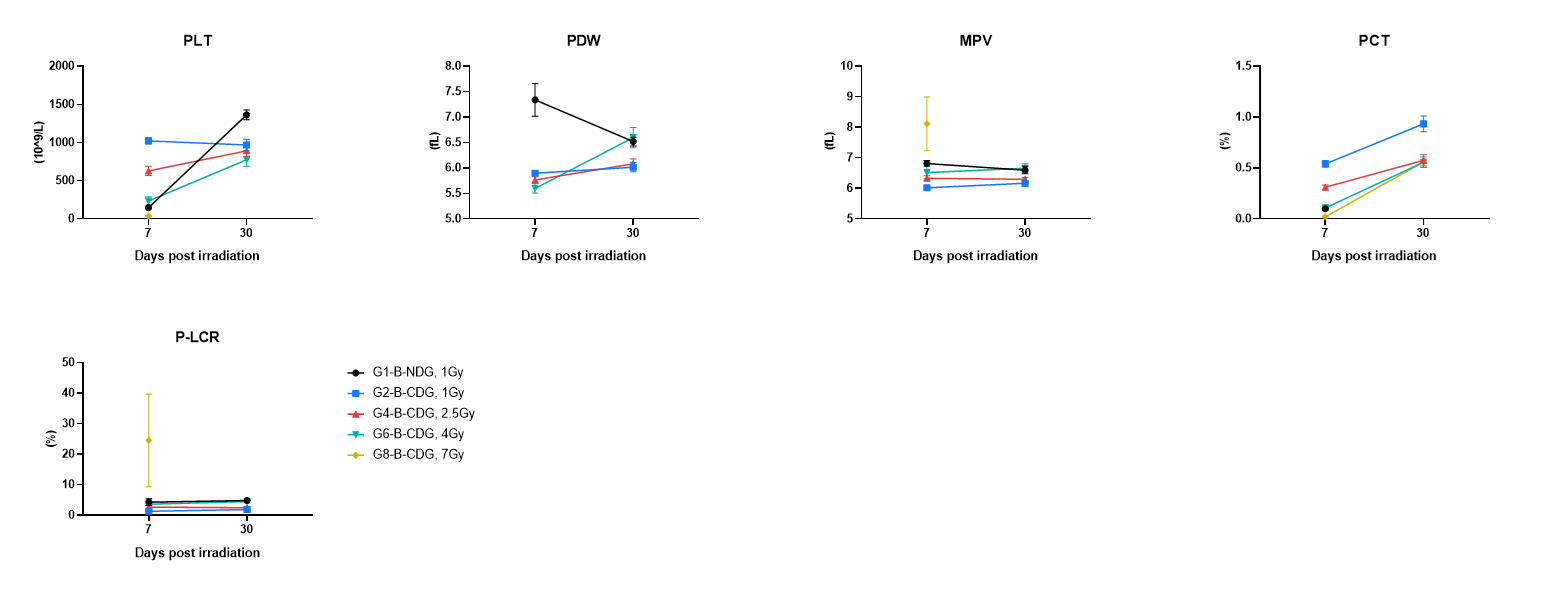
Platelet (PLT) Response: Early Thrombocytopenia and Gradual Recovery
Platelet parameters were measured at day 7 and day 30 post-irradiation. Blood were collected on the indicated days and tested by CBC. The results showed that higher dose of irradiation caused greater platelet impact, with marked reduction in platelet number/platelet production capacity at day 7 in higher-dose groups and near-recovery by day 30, again with slower recovery at higher doses. Values are expressed as mean ± SEM.
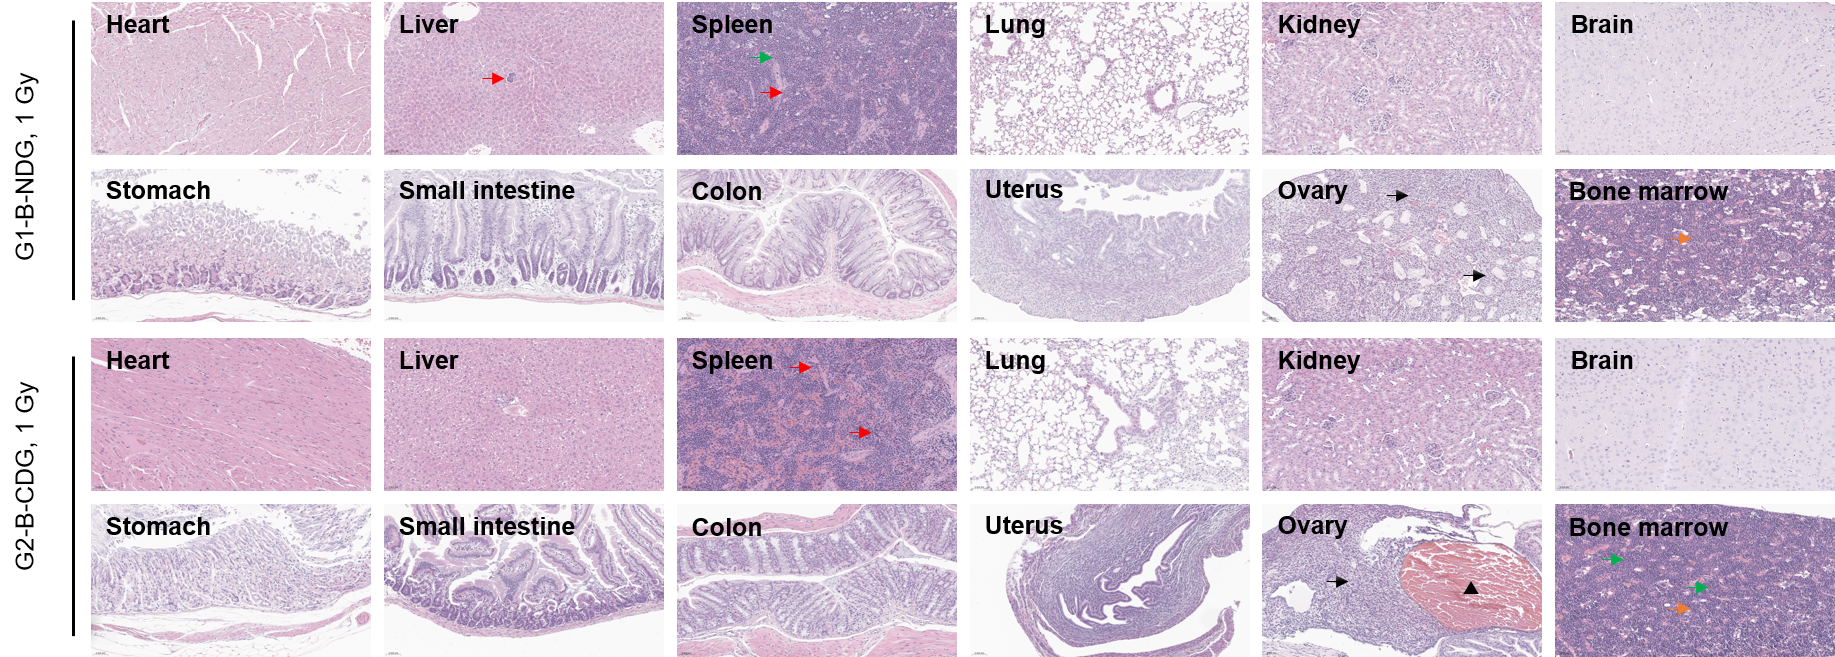
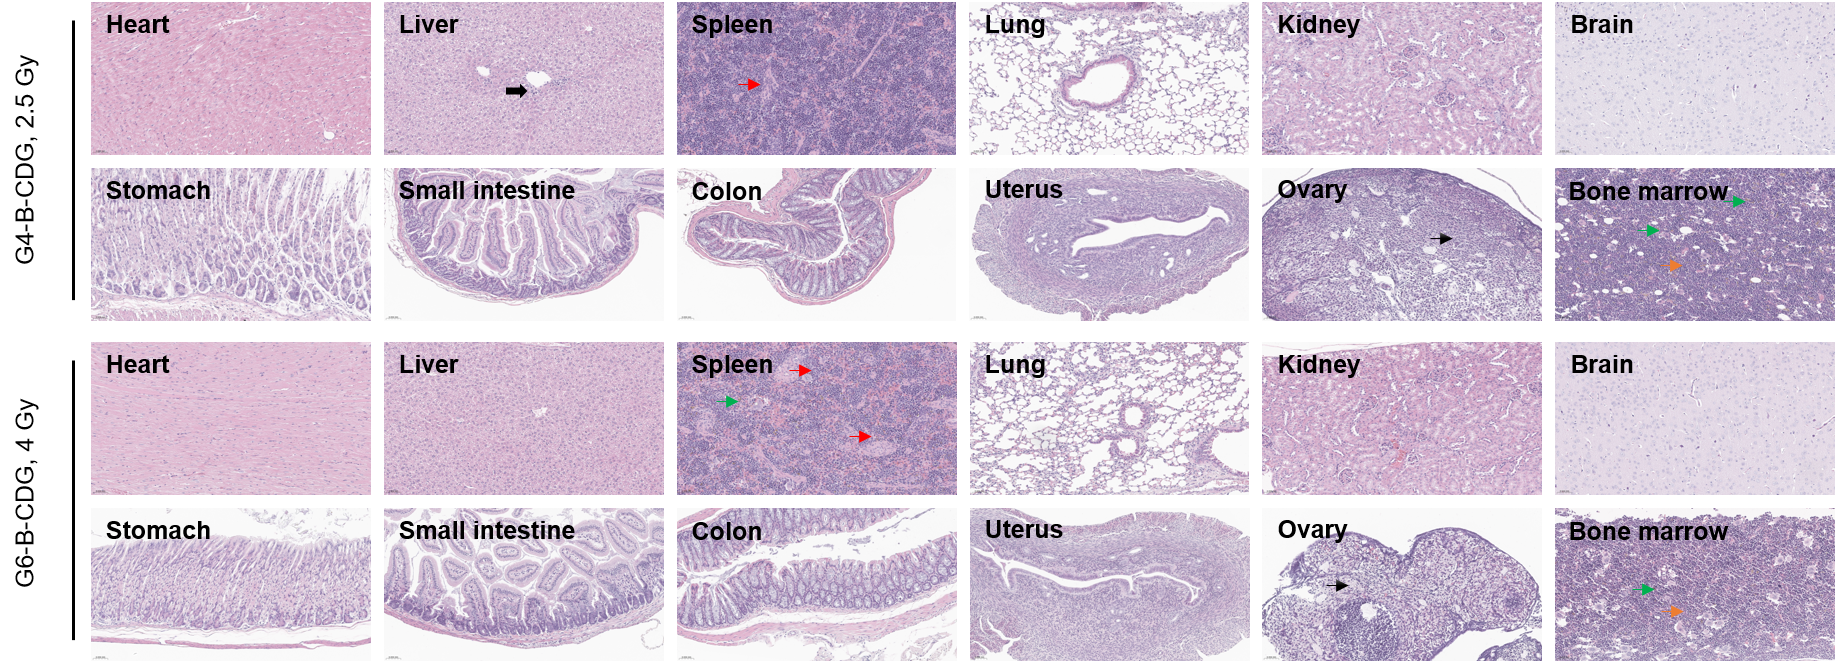
Histopathology Analysis by H&E Staining
Several organs were harvested and measured by H&E staining (400×) at day 30 post-irradiation. All groups showed significant hematopoietic stress and compensatory responses (e.g., extramedullary hematopoiesis; marrow cellularity changes). The ovarian atrophy and inflammatory infiltrates suggested gonadal radiosensitivity even when animals survive. Red arrows: extramedullary hematopoiesis; Green arrows: hyperpigmentation; Bold black arrows: inflammatory infiltrates; Thin black arrows: ovarian atrophy and proliferation of stromal cells; Orange arrows: Increased bone marrow cellularity with an elevated myeloid-to-erythroid (M:E) ratio; Black triangle: hematoma.
Successful Tumorigenicity of SHP-77 Human Small Cell Lung Cancer cell line in B-CDG mice
Tumor formation of SHP-77 human ductal breast cancer cell line in B-CDG mice. SHP-77 cells (2×10⁶) were subcutaneously inoculated into B-CDG mice (female, 7-week-old, n=6). Results showed that SHP-77 cells could successfully form tumors in B-CDG mice. Values are expressed as mean ± SEM.
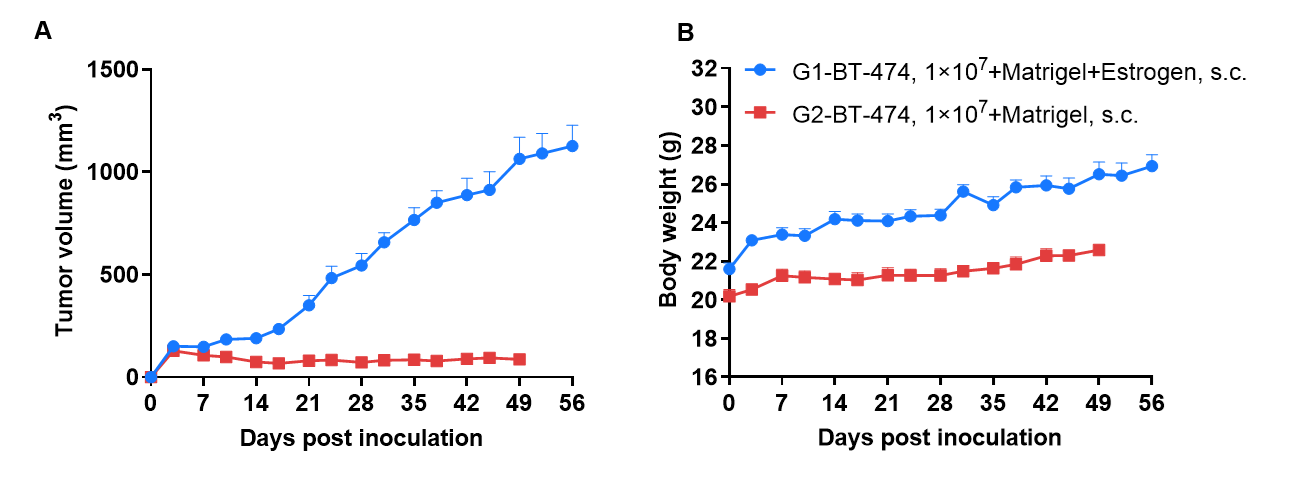
Successful Tumorigenicity of BT-474 Human Ductal Breast Carcinoma in B-CDG mice
Tumor formation of BT-474 human ductal breast cancer cell line in B-CDG mice. BT-474 cells (1×10⁷) were subcutaneously inoculated into B-CDG mice (female, 7-week-old, n=6). Results showed that BT-474 cells could successfully form tumors in B-CDG mice. Values are expressed as mean ± SEM.
Successful Tumorigenicity of AsPC-1 Human Pancreatic Cancer Cell line in B-CDG mice
Tumor formation of AsPC-1 human pancreatic cancer cell line in B-CDG mice. AsPC-1 cells (2×10⁶) were subcutaneously inoculated into B-CDG mice (female, 7-week-old, n=6). Results showed that AsPC-1 cells could successfully form tumors in B-CDG mice. Values are expressed as mean ± SEM.
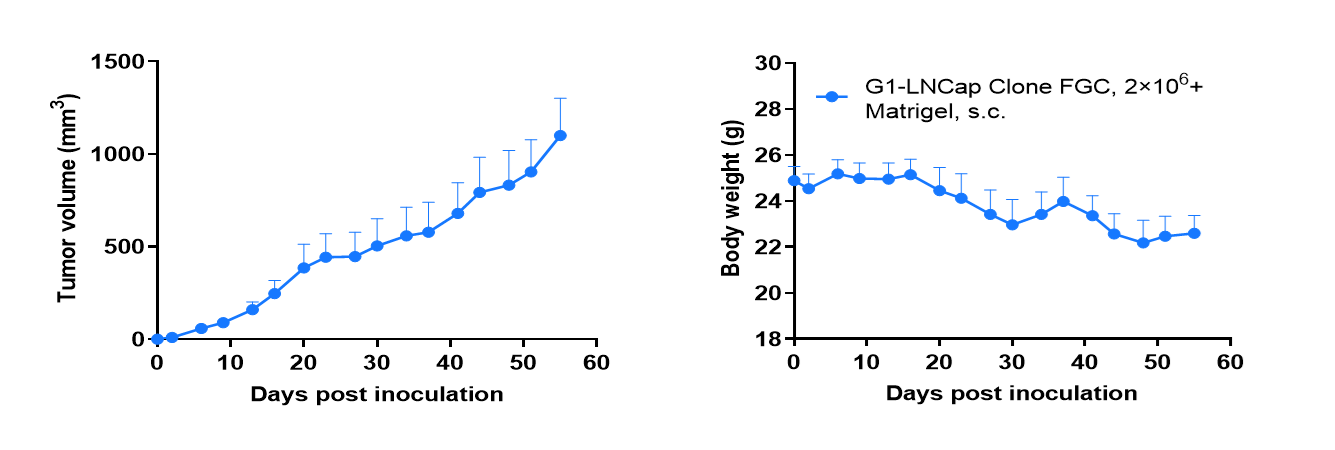
Successful Tumorigenicity of LNCap Clone FGC Human Prostate Cancer Cell line in B-CDG mice
Tumor formation of LNCap Clone FGC human prostate cancer cell line in B-CDG mice. LNCap Clone FGC cells (2×10⁶) were subcutaneously inoculated into B-CDG mice (male, 7-week-old, n=6). Results showed that LNCap Clone FGC cells could successfully form tumors in B-CDG mice. Values are expressed as mean ± SEM.
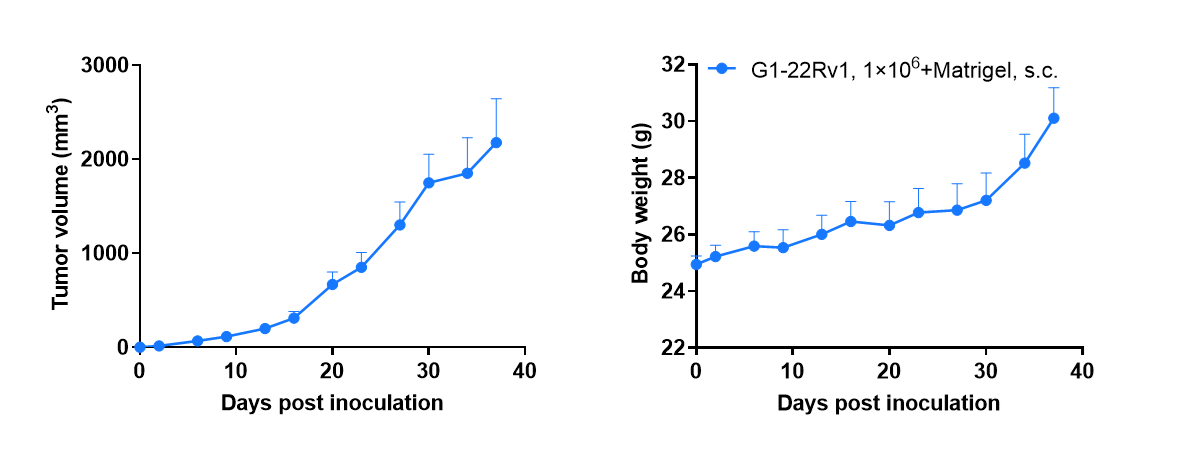
Successful Tumorigenicity of 22Rv1 Human Prostate Cancer Cell line in B-CDG mice
Tumor formation of 22Rv1 human prostate cancer cell line in B-CDG mice. 22Rv1 cells (1×10⁶) were subcutaneously inoculated into B-CDG mice (male, 7-week-old, n=6). Results showed that 22Rv1 cells could successfully form tumors in B-CDG mice. Values are expressed as mean ± SEM.
* When publishing results obtained using this animal model, please acknowledge the source as follows: The animal model [B-CDG mice] (Cat# 112937) was purchased from Biocytogen.