Description
- Background: LMNA is a significant genetic target that encodes proteins lamin A and lamin C, which are vital components of the nuclear envelope. These proteins provide structural support to the nucleus and play essential roles in maintaining genomic stability, regulating gene expression, and ensuring proper cell division. The C1824T mutation in the LMNA gene leads to Hutchinson-Gilford progeria syndrome (HGPS), a rare genetic disorder characterized by premature aging. This mutation causes the production of a truncated and misfolded protein called progerin, which accumulates in the nucleus and disrupts its normal structure and function. As a result, cells exhibit signs of premature aging, leading to the clinical manifestations of HGPS, such as rapid aging, cardiovascular diseases, and other age-related symptoms in affected individuals.
- Targeting strategy: The exons 1-12 of mouse Lmna gene that encode whole proteins are replaced by human counterparts containing p.G608G, c.C1824T mutation in B-hLMNA*G608G mice. The promoter, 5’UTR and 3’UTR region of the mouse gene are retained.
- Validation: Human LMNA mRNA was exclusively detectable in homozygous B-hLMNA*G608G mice. Truncated length of hLMNA mRNA (150 bp deletion near the C-terminus because of the p.G608G, c.C1824T mutation) was detected in homozygous B-hLMNA*G608G mice, and sequence was confirmed by Sanger sequencing. Lamin A (encoded by LMNA gene) was detectable in heart, liver, lung, colon, stomach and skeletal muscle from both wild-type C57BL/6JNifdc mice and homozygous B-hLMNA*G608G mice, as the antibody was cross-reactive between human and mouse. Human progerin was exclusively detected in heart, liver, lung, colon, stomach and skeletal muscle from homozygous B-hLMNA*G608G mice. Body size of homozygous B-hLMNA*G608G mice was smaller than wild-type C57BL/6JNifdc mice. The lengths of the femur were shortened in homozygous B-hLMNA*G608G mice. Micro-CT analysis of bone microarchitecture showed a deterioration or loss of trabecular bone structure in homozygous B-hLMNA*G608G mice, which was consistent with characteristics of osteoporosis.
- Application: This line is a disease model of Hutchinson-Gilford progeria syndrome (HGPS) and can be used in mechanisms research and drug efficacy evaluation.
Targeting strategy
Gene targeting strategy for B-hLMNA*G608G mice. The exons 1-12 of mouse Lmna gene that encode whole proteins are replaced by human counterparts containing p.G608G, c.C1824T mutation in B-hLMNA*G608G mice. The promoter, 5’UTR and 3’UTR region of the mouse gene are retained. The LMNA expression is driven by endogenous mouse Lmna promoter, while mouse Lmna gene transcription and translation will be disrupted.
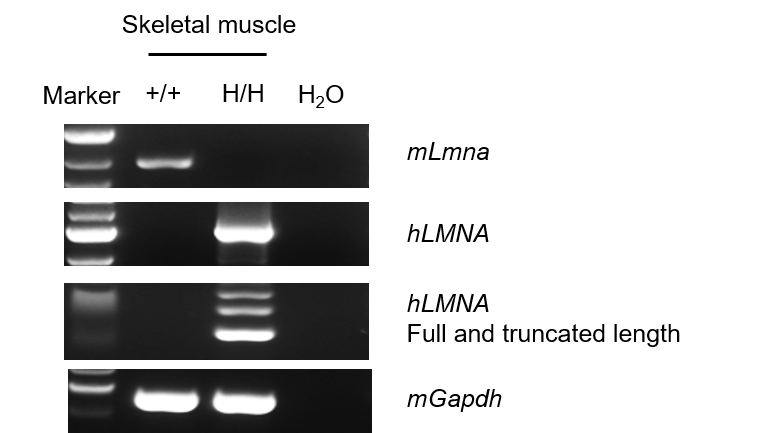
mRNA expression analysis
Strain specific analysis of LMNA mRNA expression in wild-type C57BL/6JNifdc mice and homozygous B-hLMNA*G608G mice by RT-PCR. Skeletal muscle RNA were isolated from wild-type C57BL/6JNifdc mice (+/+) and homozygous B-hLMNA*G608G mice (H/H) (n=1, 7-week-old, male), then cDNA libraries were synthesized by reverse transcription, followed by PCR with LMNA primers. Mouse Lmna was only detected in wild-type C57BL/6JNifdc mice, and human LMNA was exclusively detectable in homozygous B-hLMNA*G608G mice. Truncated length of hLMNA (150 bp deletion near the C-terminus because of the p.G608G, c.C1824T mutation) was detected in homozygous B-hLMNA*G608G mice, and sequence was confirmed by Sanger sequencing.
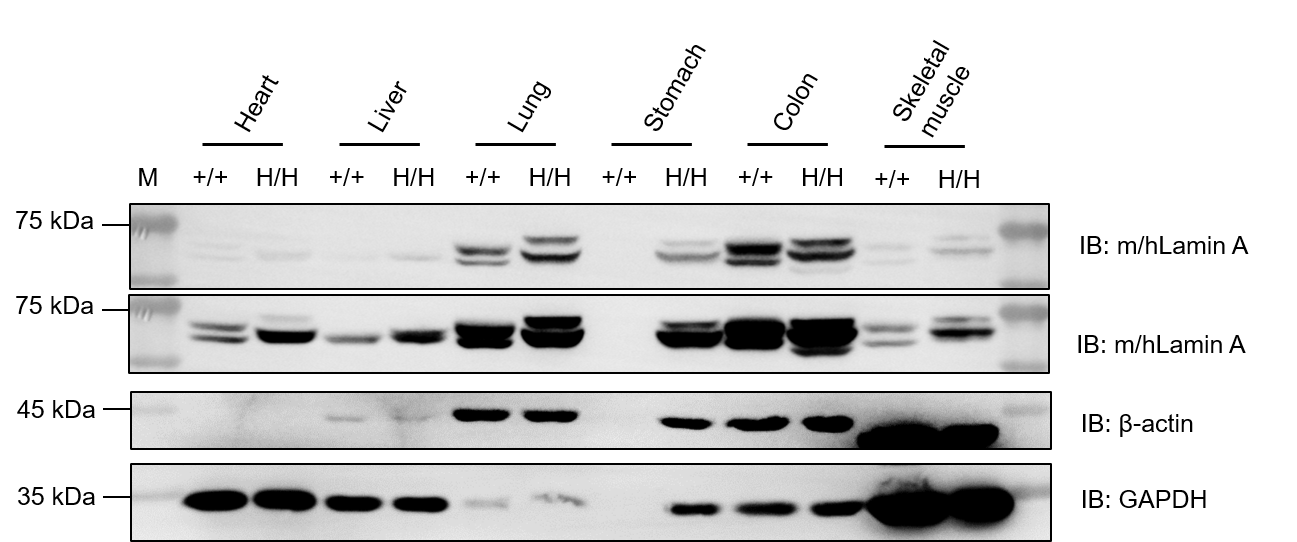
Protein expression analysis-Lamin A
Western blot analysis of Lamin A (encoded by LMNA) protein expression in wild-type C57BL/6JNidc mice and homozygous B-hLMNA*G608G mice by WB. Various tissues were collected from wild-type C57BL/6JNifdc mice (+/+) and homozygous B-hLMNA*G608G mice (H/H), and then analyzed by western blot with anti-Lamin antibody (CST, 2032T). 30 μg total proteins were loaded for western blotting analysis. GAPDH were detected as internal control. Lamin A was detectable in heart, liver, lung, colon, stomach and skeletal muscle from both wild-type C57BL/6JNifdc mice and homozygous B-hLMNA*G608G mice, as the antibody was cross-reactive between human and mouse. The upper band represents full-length Lamin A, the lower band represents progerin. M, marker.
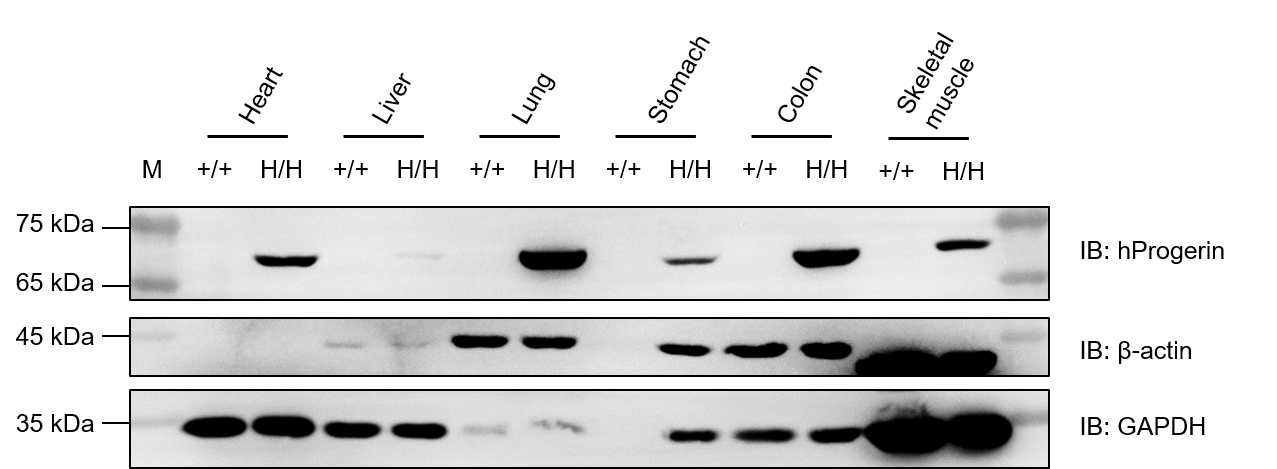
Protein expression analysis-Progerin
Western blot analysis of progerin protein expression in wild-type C57BL/6JNidc mice and homozygous B-hLMNA*G608G mice by WB. Various tissues were collected from wild-type C57BL/6JNifdc mice (+/+) and homozygous B-hLMNA*G608G mice (H/H), and then analyzed by western blot with species-specific anti-human progerin antibody (abcam, ab66587). 30 μg total proteins were loaded for western blotting analysis. GAPDH were detected as internal control. Human progerin was exclusively detected in heart, liver, lung, colon, stomach and skeletal muscle from homozygous B-hLMNA*G608G mice. M, marker.
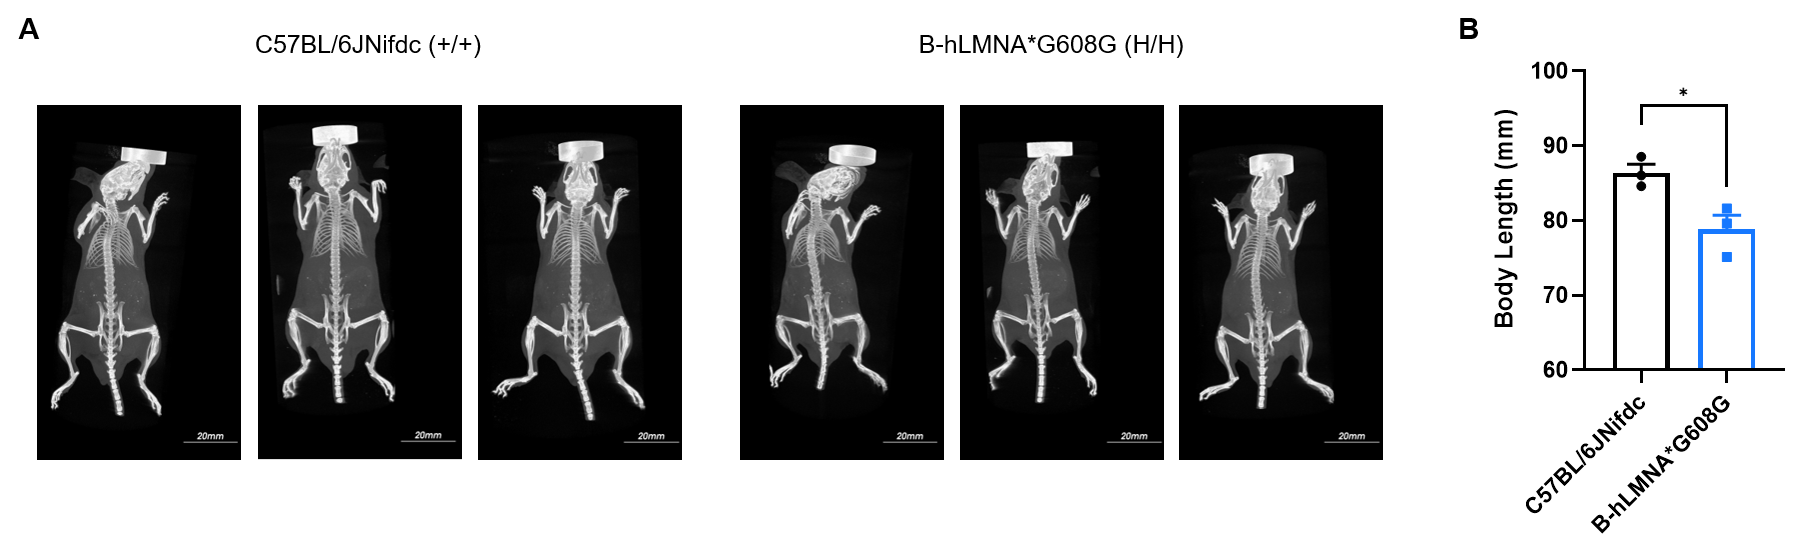
Micro-CT imaging of whole body
Whole-body micro-CT imaging of homozygous B-hLMNA*G608G mice. (A) Representative whole-body micro-CT images of mice wild-type C57BL/6JNifdc mice (n=3, male, 11-week-old) and homozygous B-hLMNA*G608G mice (n=3, male, 11-week-old). (B) Quantitative comparison of body length (from oral-nasal region to tail tip). Body size of homozygous B-hLMNA*G608G mice was smaller than wild-type C57BL/6JNifdc mice. Data are presented as mean ± SEM. *P < 0.05, **P < 0.01, ***P < 0.001. Scale bar = 20 mm.
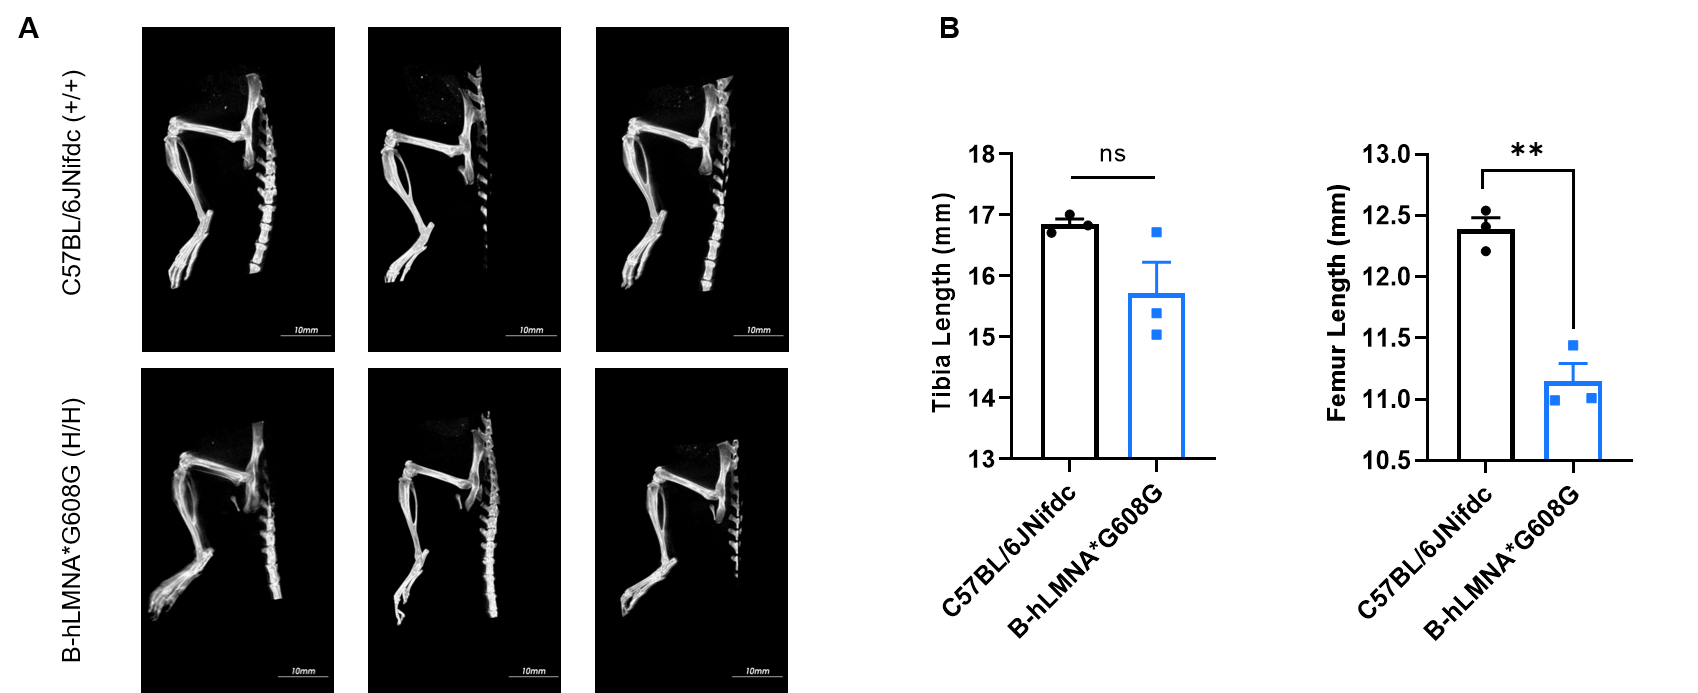
Micro-CT analysis of femur and tibia length
Micro-CT analysis of femur and tibia length in homozygous B-hLMNA*G608G mice. (A) Representative micro-CT images of femur and tibia from wild-type C57BL/6JNifdc mice (n=3, male, 11-week-old) and homozygous B-hLMNA*G608G mice (n=3, male, 11-week-old). (B) Quantitative comparison of femur and tibia length. In the homozygous B-hLMNA*G608G mice, the lengths of the femur were shortened. Data are presented as mean ± SEM. *P < 0.05, **P < 0.01, ***P < 0.001. Scale bar = 10 mm.
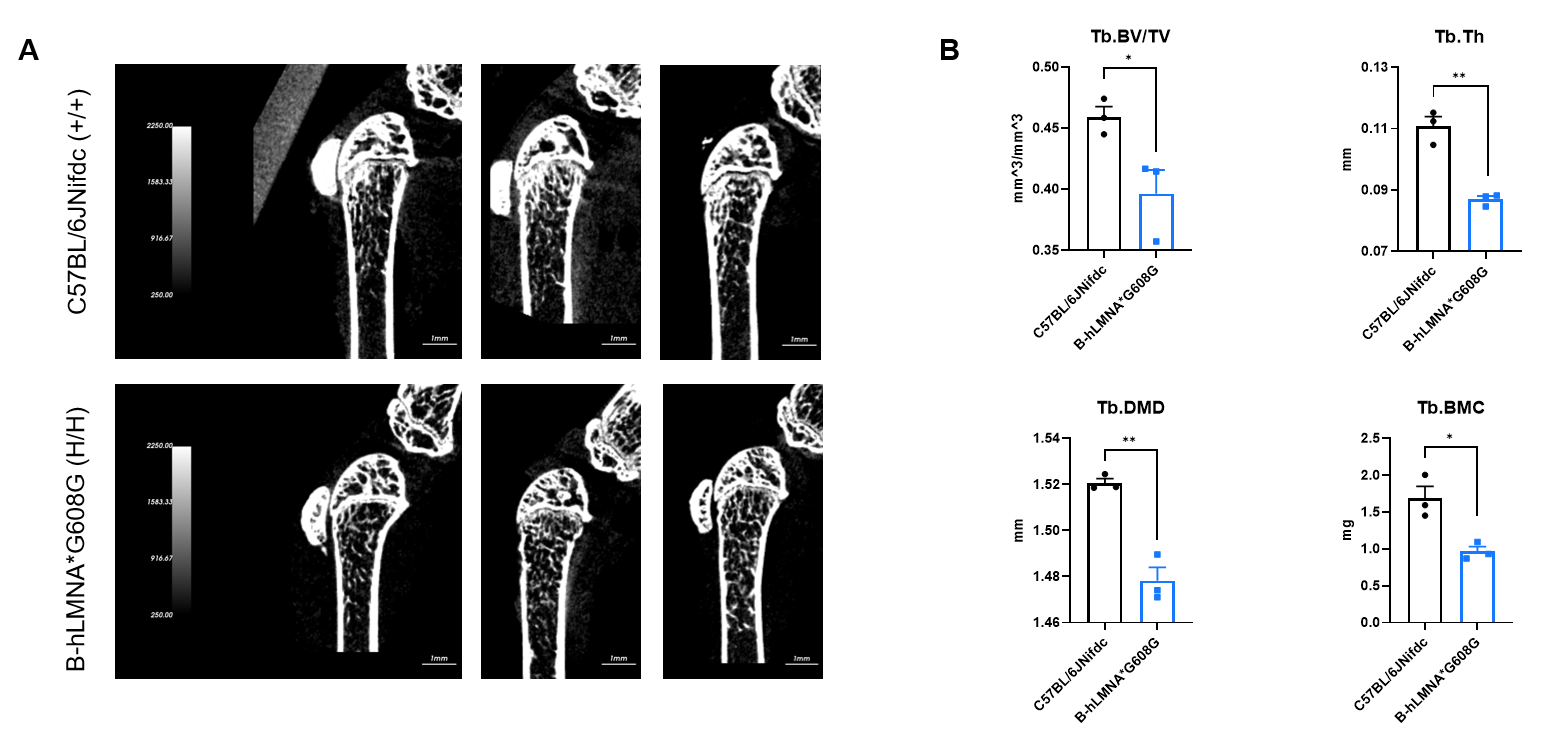
Micro-CT analysis of bone microarchitecture
Micro-CT analysis of bone microarchitecture in homozygous B-hLMNA*G608G mice. (A) Representative micro-CT images of trabecular bone from wild-type C57BL/6JNifdc mice (n=3, male, 11-week-old) and homozygous B-hLMNA*G608G mice (n=3, male, 11-week-old). (B) Quantitative analysis of bone volume fraction (Tb.BV/TV), trabecular thickness (Tb.Th), trabecular bone mineral density (Tb.BMD) and trabecular bone mineral content (Tb.BMC). Tb.BV/TV, Tb.Th, Tb.BMC decreased in homozygous B-hLMNA*G608G mice compared with wild-type mice, indicating a deterioration or loss of trabecular bone structure, which is consistent with characteristics of osteoporosis. Data are presented as mean ± SEM. *P < 0.05, **P < 0.01, ***P < 0.001.
* When publishing results obtained using this animal model, please acknowledge the source as follows: The animal model [B-hLMNA*G608G mice] (Cat# 113262) was purchased from Biocytogen.