mRNA expression analysis
Strain specific analysis of TREM1 gene expression in wild type C57BL/6 (+/+) mice and homozygous B-hTREM1(H/H) mice by RT-qPCR. The mRNA expression of hTREM1 in B-hTREM1(H/H) was similar to mTrem1 in the C57BL/6 (+/+), demonstrating that introduction of hTREM1 in place of its mouse counterpart does not change the expression level of TREM1 mRNA.
Protein expression analysis
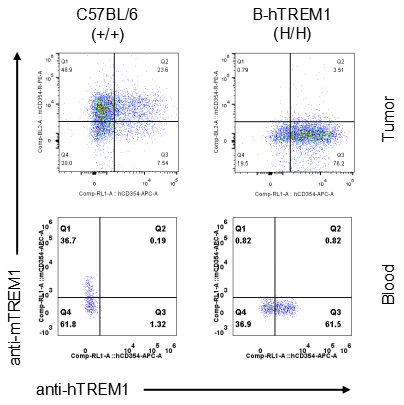
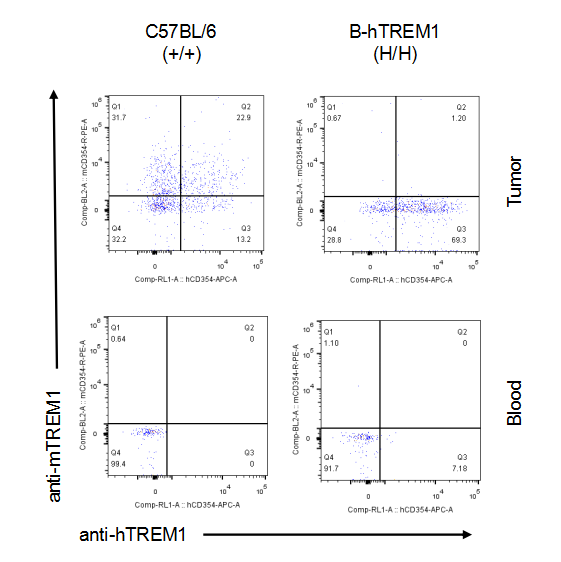
Strain specific TREM1 expression analysis in homozygous B-hTREM1 mice by flow cytometry.MC38 cells were inoculated into wild-type C57BL/6(+/+) and homozygous B-hTREM1 mice(H/H). Blood and tumor were harvested when tumor volume reached approximately 500 mm3, and analyzed by flow cytometry with species-specific anti-TREM1 antibody. Mouse TREM1 was exclusively detectable in blood and tumor macrophage of wild-type mice. Human TREM1 was exclusively detectable in blood and tumor macrophage of homozygous B-hTREM1 mice.* It is not clear what population of cells was stained with specific anti-hTREM1 in tumors of C57BL/6 (Q2).
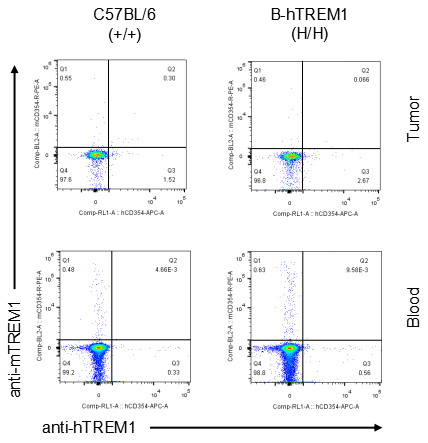
Strain specific TREM1 expression analysis in homozygous B-hTREM1 mice by flow cytometry.MC38 cells were inoculated into wild-type C57BL/6(+/+) and homozygous B-hTREM1 mice(H/H). Blood and tumor were harvested when tumor volume reached approximately 500 mm3, and analyzed by flow cytometry with species-specific anti-TREM1 antibody. Mouse and human TREM1 were not detectable in blood monocyte of wild-type mice and homozygous B-hTREM1 mice. Human TREM1 was exclusively detectable in tumor M-MDSC of homozygous B-hTREM1 mice.* It is not clear what population of cells was stained with specific anti-hTREM1 in tumors of C57BL/6 (Q2).
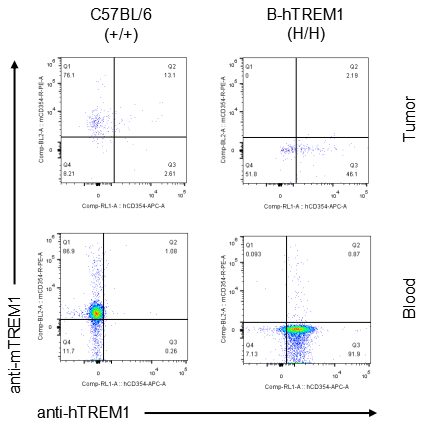
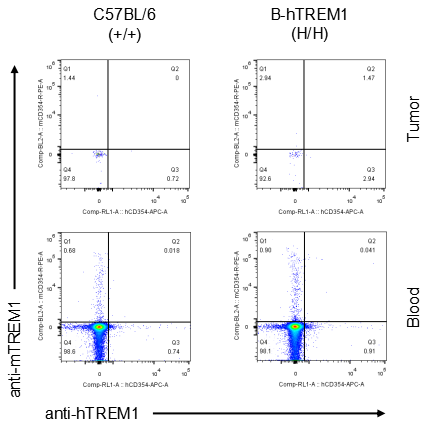
Strain specific TREM1 expression analysis in homozygous B-hTREM1 mice by flow cytometry.MC38 cells were inoculated into wild-type C57BL/6(+/+) and homozygous B-hTREM1 mice(H/H). Blood and tumor were harvested when tumor volume reached approximately 500 mm3, and analyzed by flow cytometry with species-specific anti-TREM1 antibody. Mouse TREM1 was exclusively detectable in blood and tumor neutrophil(G-MDSC) of wild-type mice. Human TREM1 was exclusively detectable in blood and tumor neutrophil(G-MDSC) of homozygous B-hTREM1 mice.
Strain specific TREM1 expression analysis in homozygous B-hTREM1 mice by flow cytometry.MC38 cells were inoculated into wild-type C57BL/6(+/+) and homozygous B-hTREM1 mice(H/H). Blood and tumor were harvested when tumor volume reached approximately 500 mm3, and analyzed by flow cytometry with species-specific anti-TREM1 antibody. Mouse and human TREM1 were not detectable in blood and tumor T cells of wild-type mice and homozygous B-hTREM1 mice.
Strain specific TREM1 expression analysis in homozygous B-hTREM1 mice by flow cytometry.MC38 cells were inoculated into wild-type C57BL/6(+/+) and homozygous B-hTREM1 mice(H/H). Blood and tumor were harvested when tumor volume reached approximately 500 mm3, and analyzed by flow cytometry with species-specific anti-TREM1 antibody. Mouse and human TREM1 were not detectable in blood and tumor B cells of wild-type mice and homozygous B-hTREM1 mice.
Analysis of leukocytes cell subpopulation in spleen
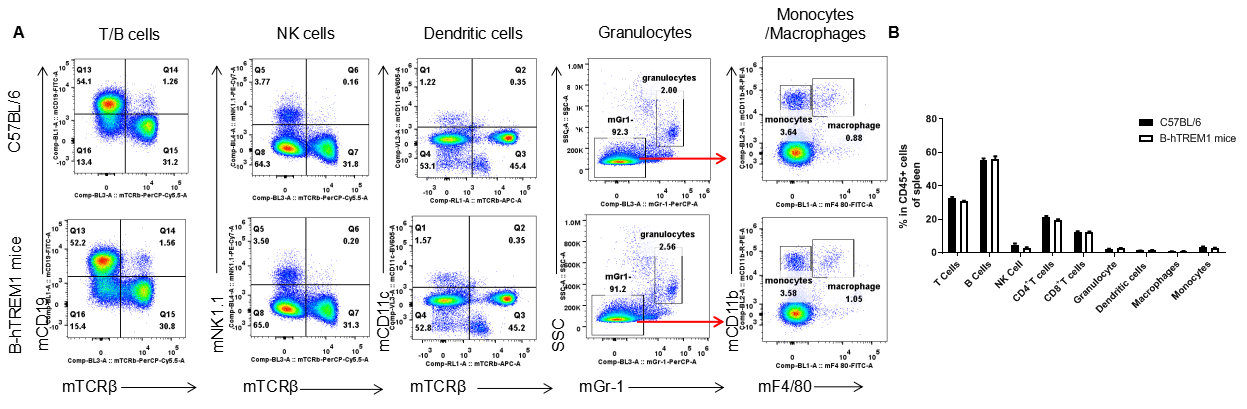
Analysis of spleen leukocyte subpopulations by FACS. Splenocytes were isolated from female C57BL/6 and B-hTREM1 mice (n=3, 6-week-old). Flow cytometry analysis of the splenocytes was performed to assess leukocyte subpopulations. A. Representative FACS plots. Single live cells were gated for the CD45+ population and used for further analysis as indicated here. B. Results of FACS analysis. Percent of T cell, B cell, NK cell, monocyte, dendritic cell, granulocyte and macrophage in homozygous B-hTREM1 mice were similar to those in the C57BL/6 mice, demonstrating that TREM1 humanized does not change the overall development, differentiation or distribution of these cell types in spleen. Values are expressed as mean ± SEM.
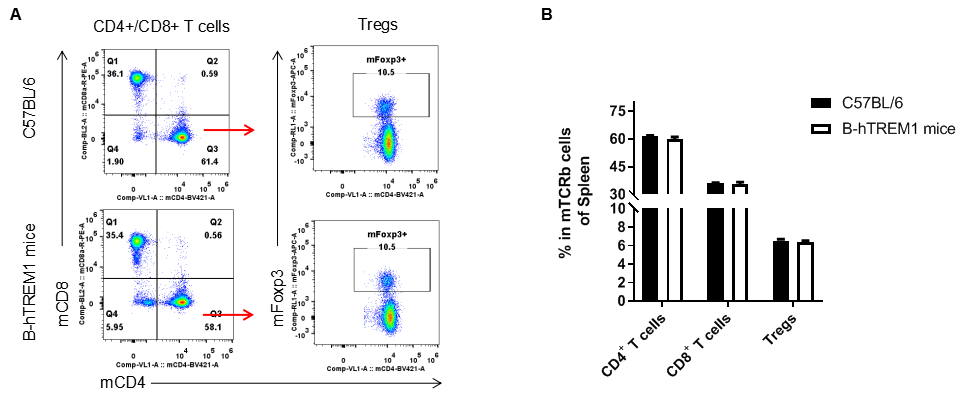
Analysis of T cell subpopulation in spleen
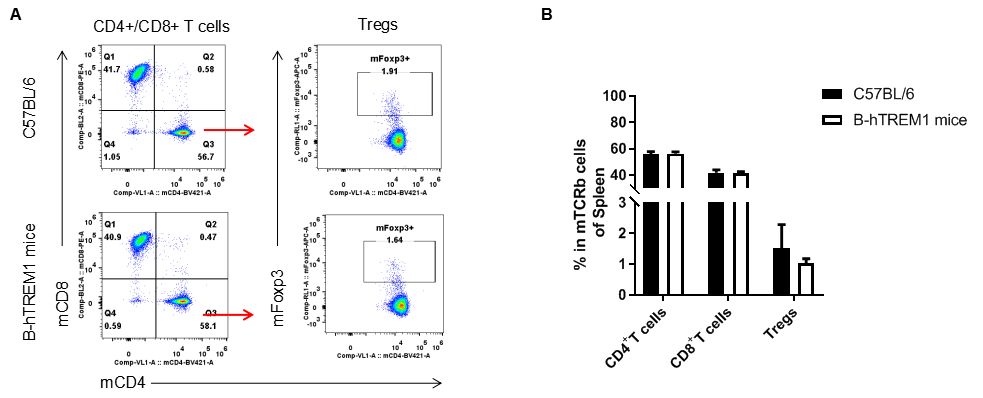
Analysis of spleen T cell subpopulations by FACS. Splenocytes were isolated from female C57BL/6 and B-hTREM1 mice (n=3, 6-week-old). Flow cytometry analysis of the splenocytes was performed to assess leukocyte subpopulations. A. Representative FACS plots. Single live CD45+ cells were gated for TCRβ+T cell population and used for further analysis as indicated here. B. Results of FACS analysis. There were no differences between C57BL/6 and B-hTREM1 mice, demonstrating that humanized of TREM1 does not change the overall development, differentiation or distribution of these T cell subtypes. Values are expressed as mean ± SEM.
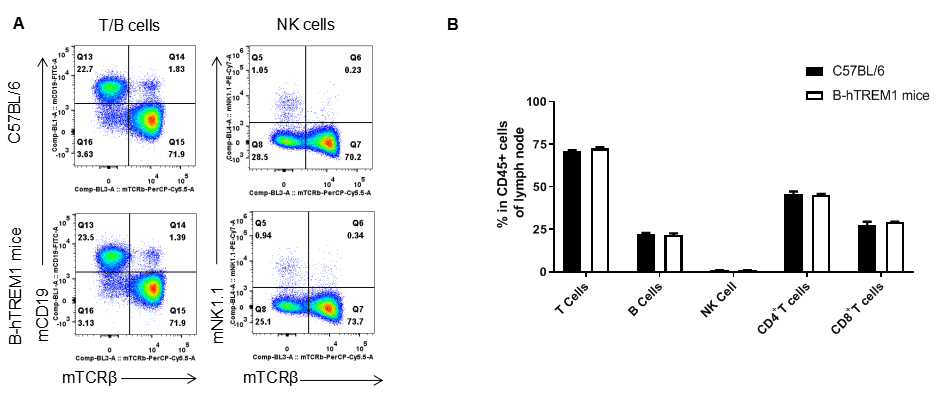
Analysis of leukocytes cell subpopulation in LNs
Analysis of LNs leukocyte subpopulations by FACS. LNs were isolated from female C57BL/6 and B-hTREM1 mice (n=3, 6-week-old). Flow cytometry analysis of the LNs was performed to assess leukocyte subpopulations. A. Representative FACS plots. Single live cells were gated for the CD45+ population and used for further analysis as indicated here. B. Results of FACS analysis. Percent of T cell, B cell, NK cell in homozygous B-hTREM1 mice were similar to those in the C57BL/6 mice, demonstrating that TREM1 humanized does not change the overall development, differentiation or distribution of these cell types in spleen. Values are expressed as mean ± SEM.
Analysis of T cell subpopulation in LNs
Analysis of LNs T cell subpopulations by FACS. LNs were isolated from female C57BL/6 and B-hTREM1 mice (n=3, 6-week-old). Flow cytometry analysis of the LNs was performed to assess leukocyte subpopulations. A. Representative FACS plots. Single live CD45+ cells were gated for TCRβ+T cell population and used for further analysis as indicated here. B. Results of FACS analysis. . There were no differences between C57BL/6 and B-hTREM1 mice, demonstrating that humanized of TREM1 does not change the overall development, differentiation or distribution of these T cell subtypes. Values are expressed as mean ± SEM.
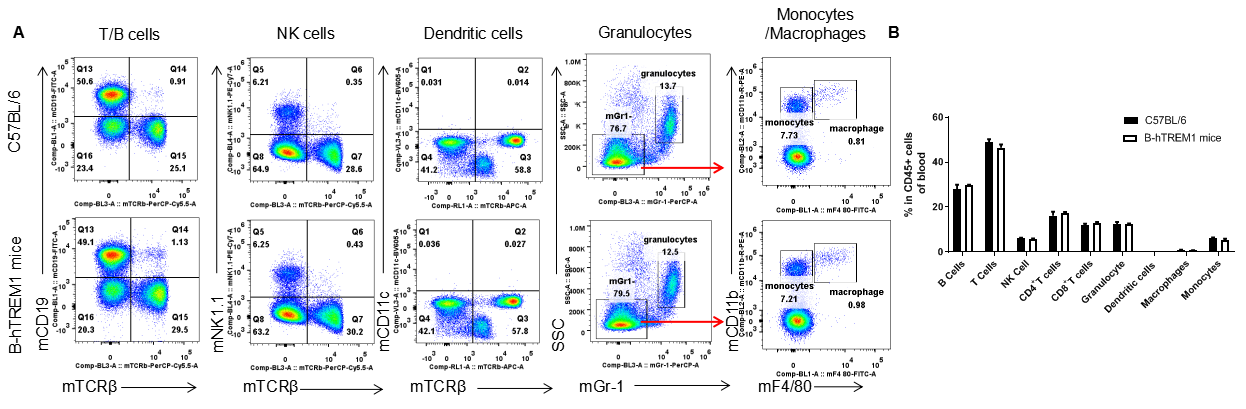
Analysis of leukocytes cell subpopulation in blood
Analysis of blood leukocyte subpopulations by FACS. Blood were isolated from female C57BL/6 and B-hTREM1 mice (n=3, 6-week-old). Flow cytometry analysis of the blood was performed to assess leukocyte subpopulations. A. Representative FACS plots. Single live cells were gated for the CD45+ population and used for further analysis as indicated here. B. Results of FACS analysis. Percent of T cell, B cell, NK cell, monocyte, dendritic cell, granulocyte and macrophage in homozygous B-hTREM1 mice were similar to those in the C57BL/6 mice, demonstrating that TREM1 humanized does not change the overall development, differentiation or distribution of these cell types in blood. Values are expressed as mean ± SEM.
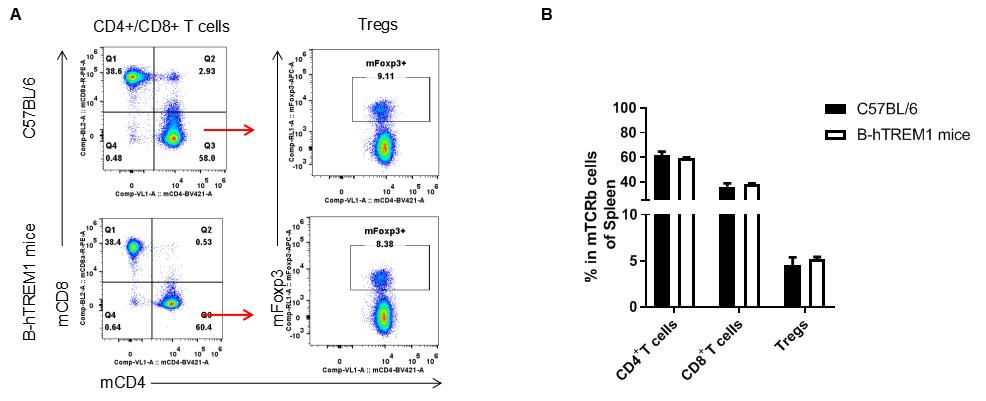
Analysis of T cell subpopulation in blood
Analysis of blood T cell subpopulations by FACS. Blood were isolated from female C57BL/6 and B-hTREM1 mice (n=3, 6-week-old). Flow cytometry analysis of the blood was performed to assess leukocyte subpopulations. A. Representative FACS plots. Single live CD45+ cells were gated for TCRβ+T cell population and used for further analysis as indicated here. B. Results of FACS analysis. There were no differences between C57BL/6 and B-hTREM1 mice, demonstrating that humanized of TREM1 does not change the overall development, differentiation or distribution of these T cell subtypes. Values are expressed as mean ± SEM.
Functional Analysis
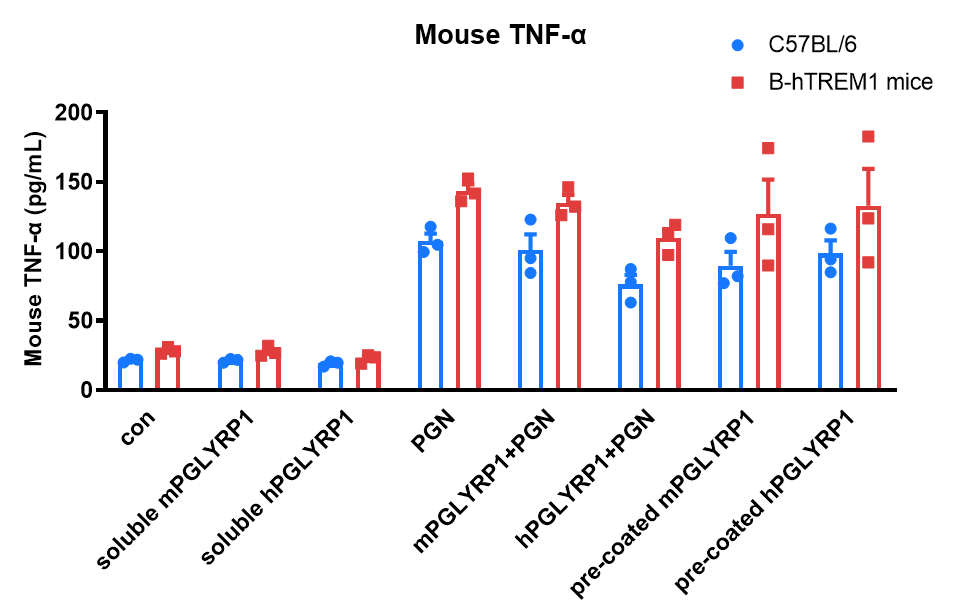
Bone marrow-derived macrophages from B-hTREM1 mice can be activated by its ligand PGLYRP1. Bone marrow-derived macrophages induced with M-CSF from wild-type C57BL/6 and B-hTREM1 mice were stimulated with m/hPGLYRP1 under the indicated conditions for 24 hours, and the levels of mouse TNF-α in the supernatant were measured. The results show that PGN alone, co-stimulation with m/hPGLYRP1 and PGN, and pre-coated m/hPGLYRP1 all significantly activated macrophages. These findings indicate that human TREM1 can be activated by its ligand PGLYRP1 in B-hTREM1 mice and that cross-reactivity exists between human and mouse ligand-receptor interactions. Values are expressed as mean ± SEM. Significance was determined by two-way ANOVA test.
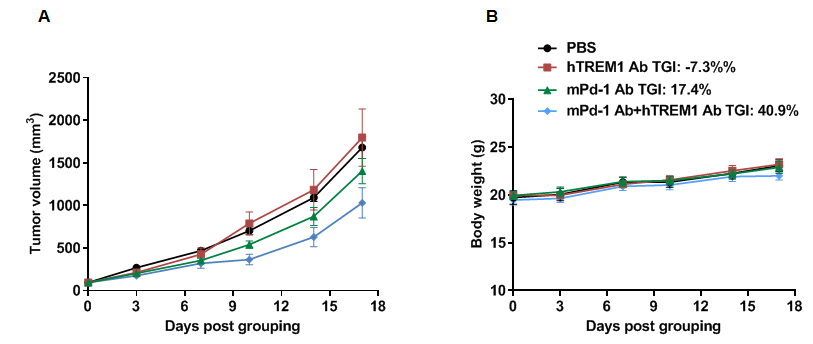
Analysis of hTREM1 function in B-hTREM1 mice
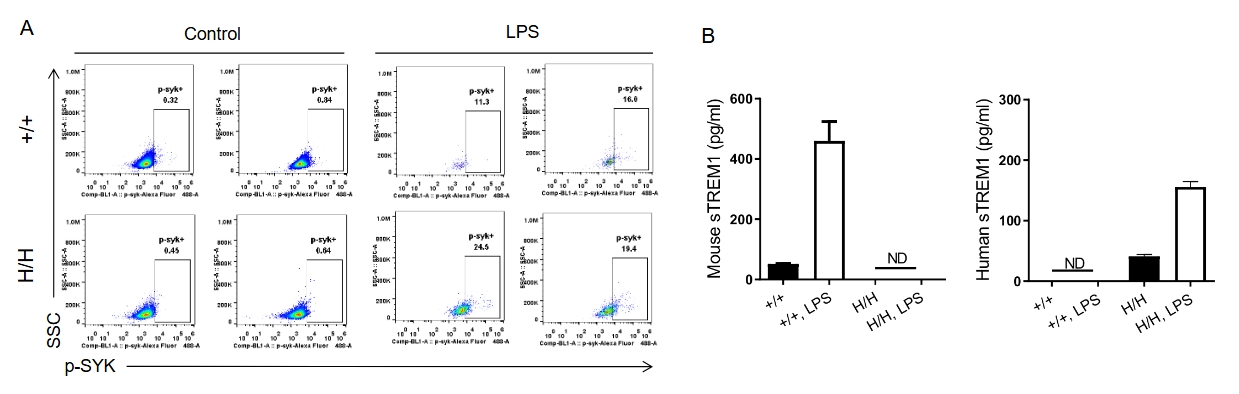
Analysis of the hTREM1 function in B-hTREM1 mice. Wild-type C57BL/6 mice(+/+) and B-hTREM1 mice(H/H) were randomly grouped and injected intraperitoneally (i.p.) with LPS from E.coli(500 ug/mouse). Serum and peritoneal macrophages were collected after LPS administration. Under LPS-stimulated conditions, human TREM1 could be activated effectively and then induced rapid phosphorylation of Syk in B-hTREM1 mice(A). Additionally, soluble TREM1 were upregulated in the serum of B-hTREM1 mice (B), indicating that mouse matrix metalloproteinase(MMP) was capable of proteolytically cleaving human TREM1, and inducing the release of soluble TREM1. ND, not detected.
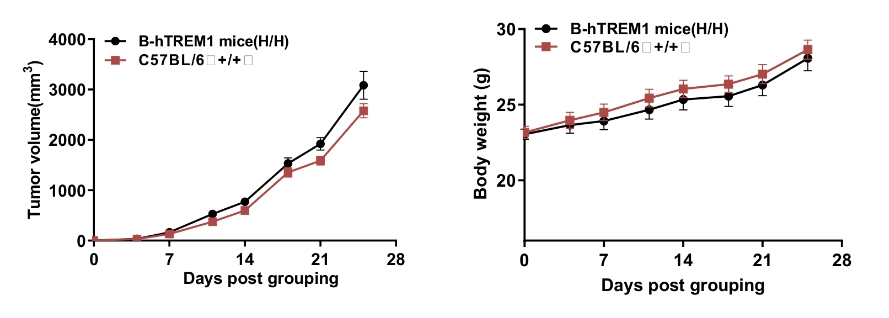
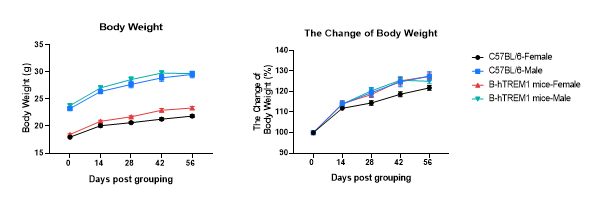
Growth Curve of B-hTREM1 mice
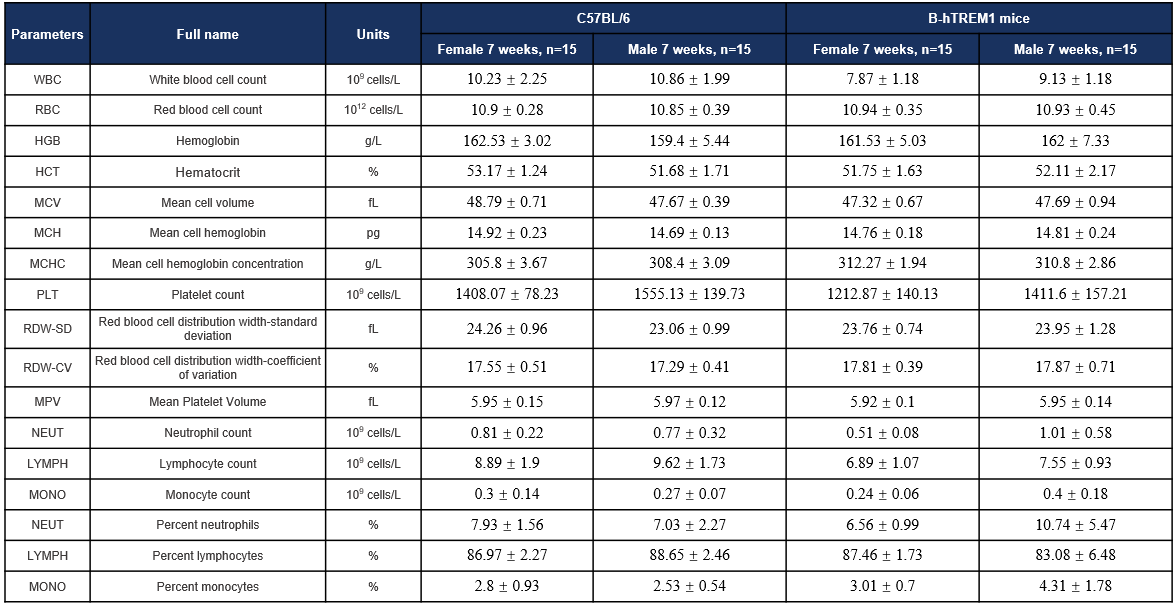
Hematology-7W
Complete blood count (CBC). Values are expressed as mean ± SD.
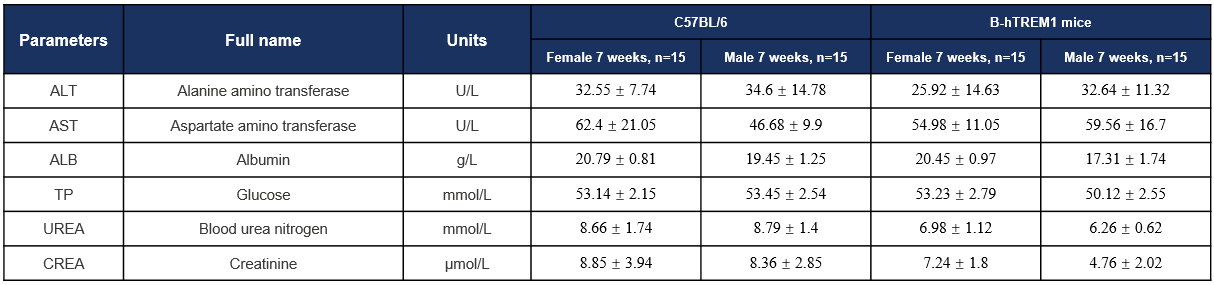
Biochemistry Analysis-7w
Biochemical analysis. Values are expressed as mean ± SD.
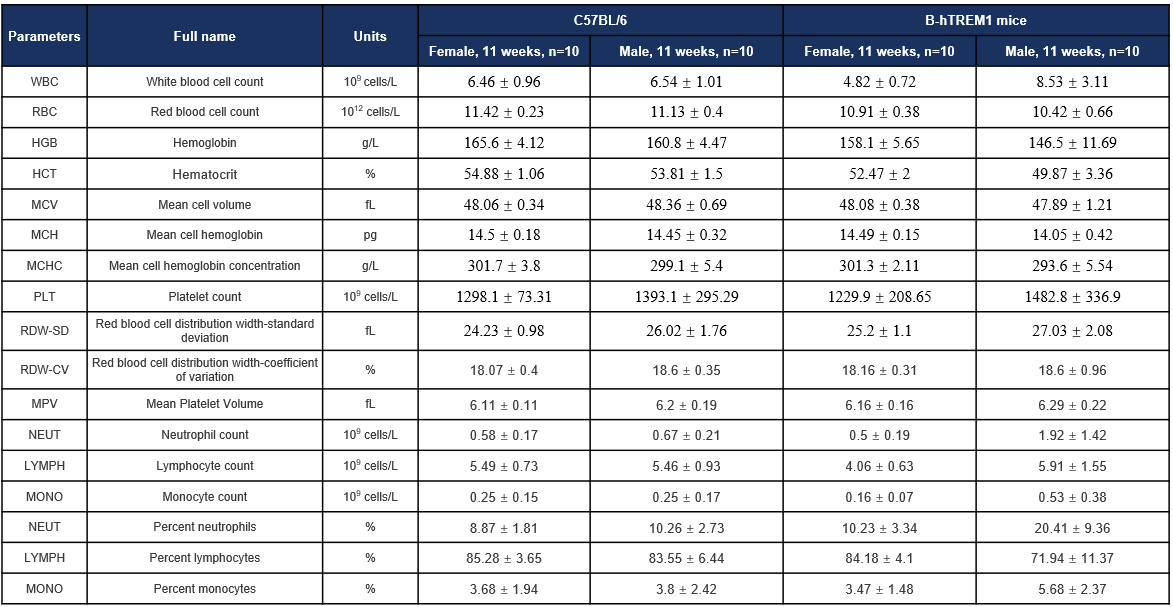
Hematology-11W
Complete blood count (CBC). Values are expressed as mean ± SD.
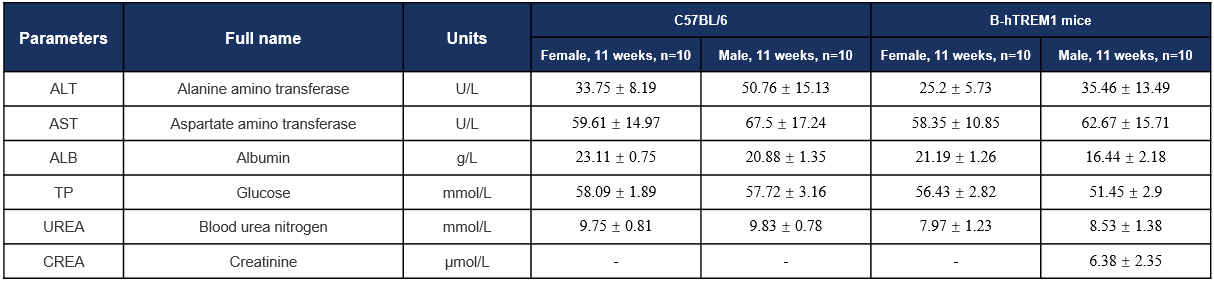
Biochemistry Analysis-11w
Biochemical analysis. Values are expressed as mean ± SD.
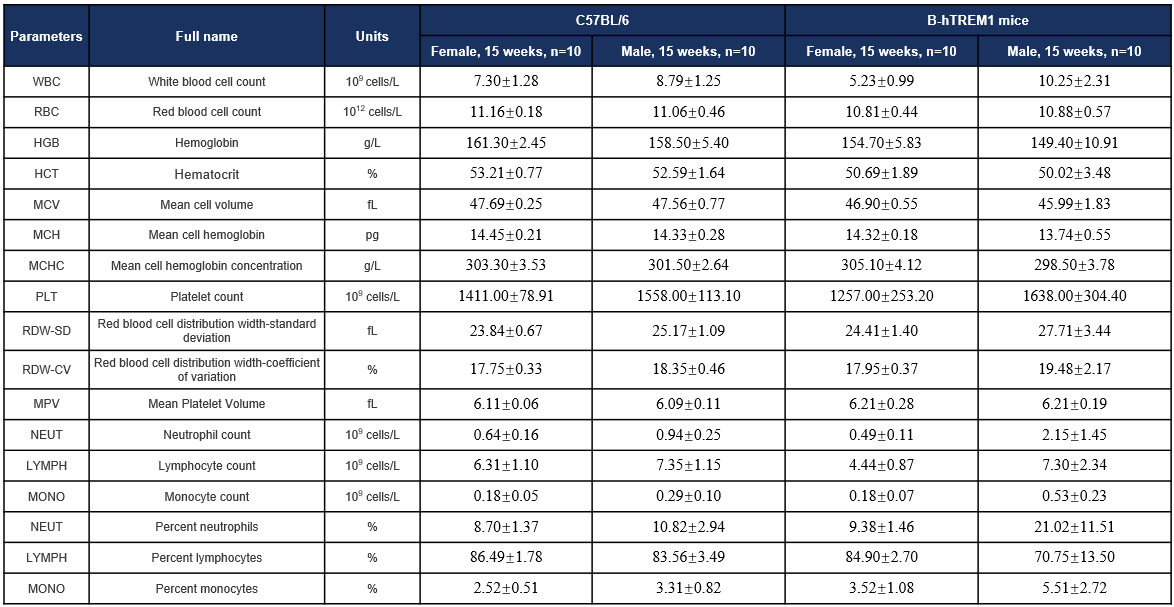
Hematology-15W
Complete blood count (CBC). Values are expressed as mean ± SD.
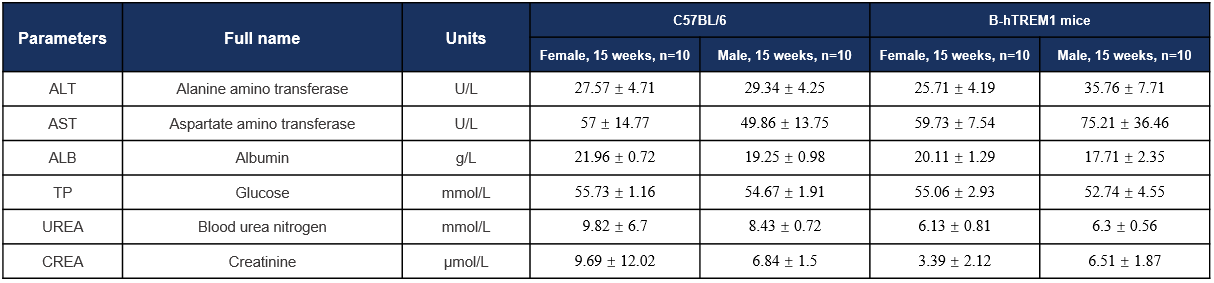
Biochemistry Analysis-15w
Biochemical analysis. Values are expressed as mean ± SD.
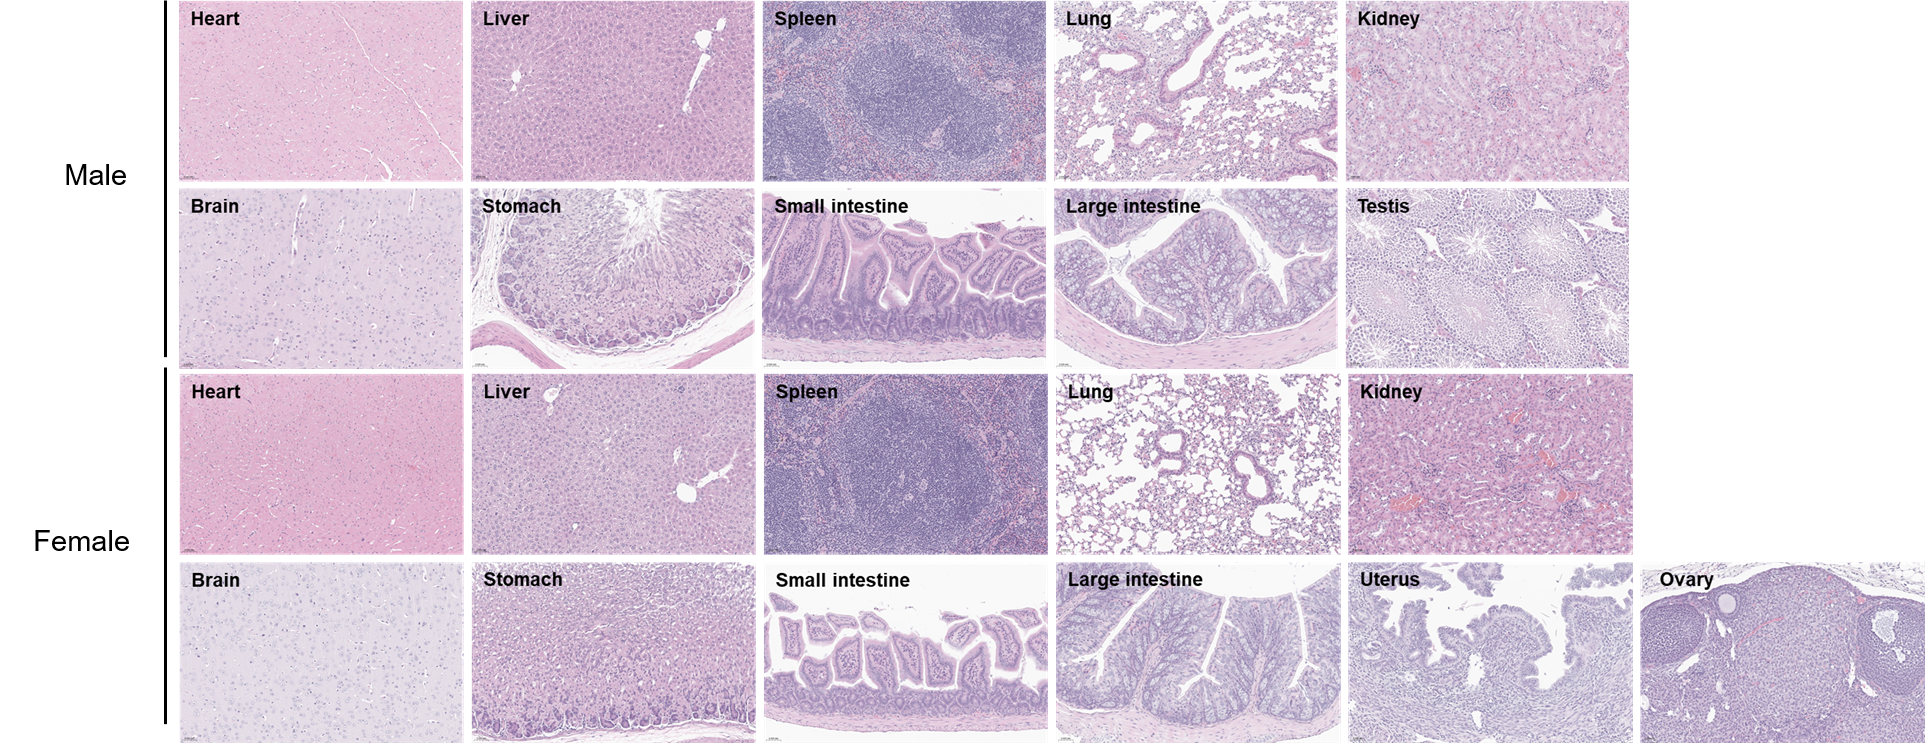
Histopathological Analysis
Histopathological analysis of organs in C57BL/6 mice. The main organs of C57BL/6 mice were isolated at 15 weeks of age and analyzed with H&E staining (male, n=5; female, n=5). Results showed that no obvious abnormalities were found in all of the organs (heart, liver, spleen, lung, kidney, brain, stomach, small intestine, large intestine, ovary, uterus and testis). Scale bar: 50 μm.
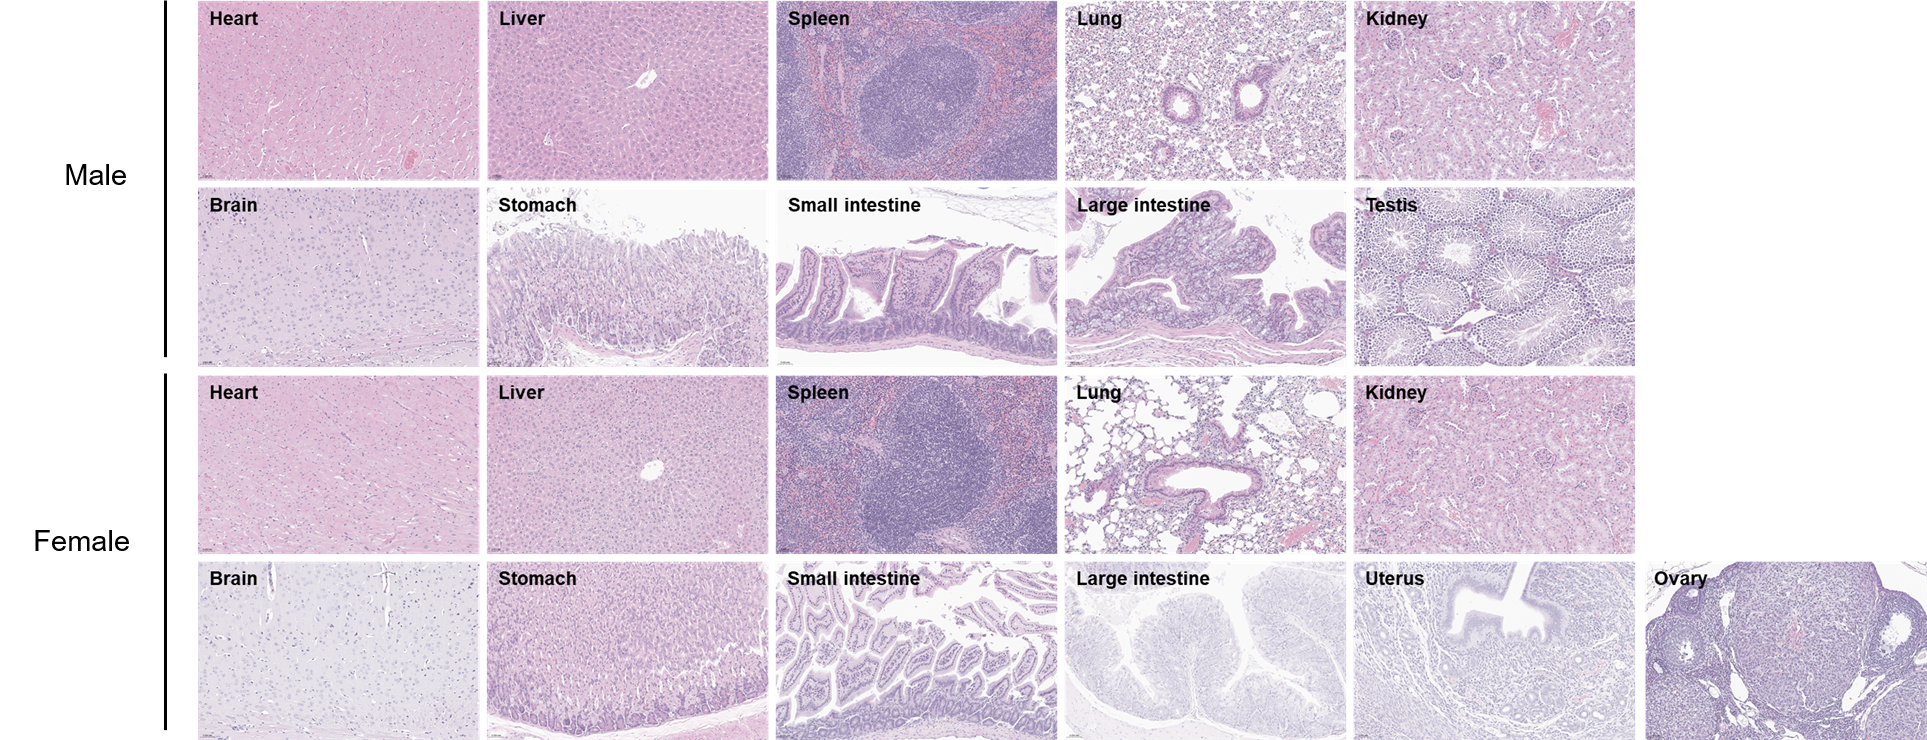
Histopathological analysis of organs in B-hTREM1 mice. The main organs of B-hTREM1 mice were isolated at 15 weeks of age and analyzed with H&E staining (male, n=5; female, n=5). Results showed that no obvious abnormalities were found in all of the organs (heart, liver, spleen, lung, kidney, brain, stomach, small intestine, large intestine, ovary, uterus and testis). Scale bar: 50 μm.
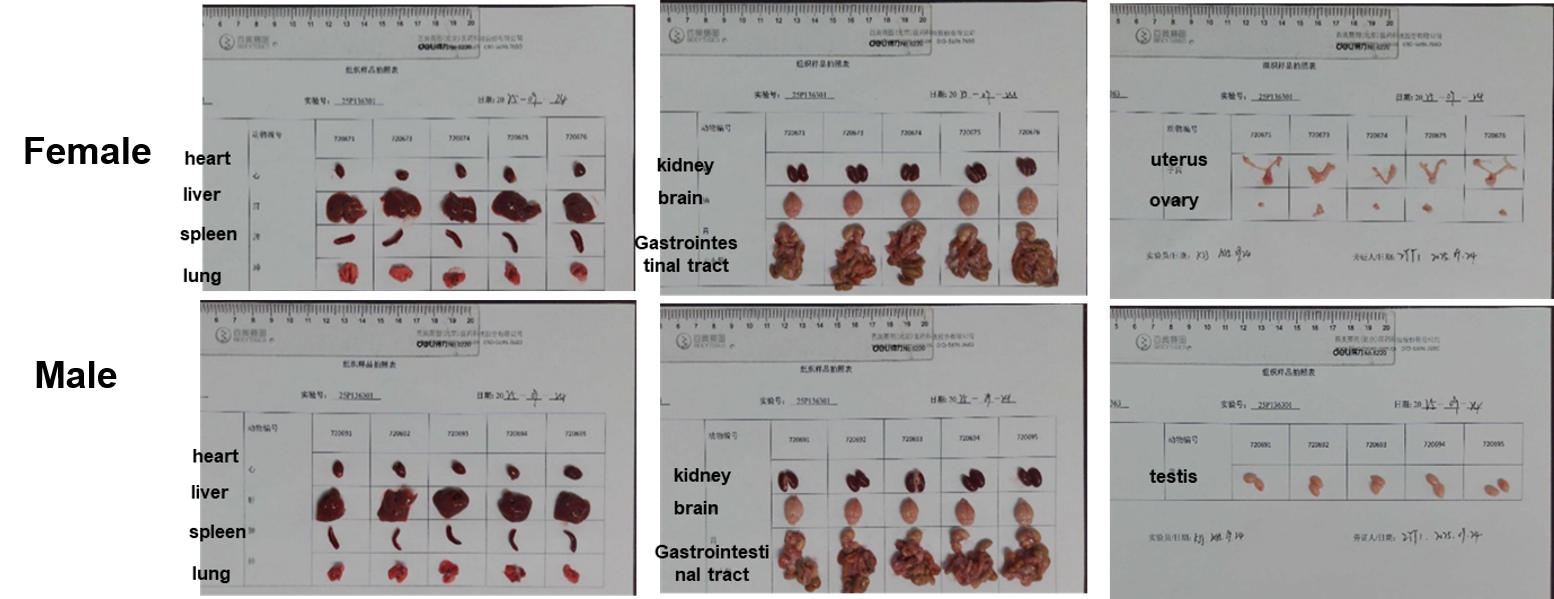
Gross Anatomy of C57BL/6
The organs of C57BL/6 (7-week-old, n=5).
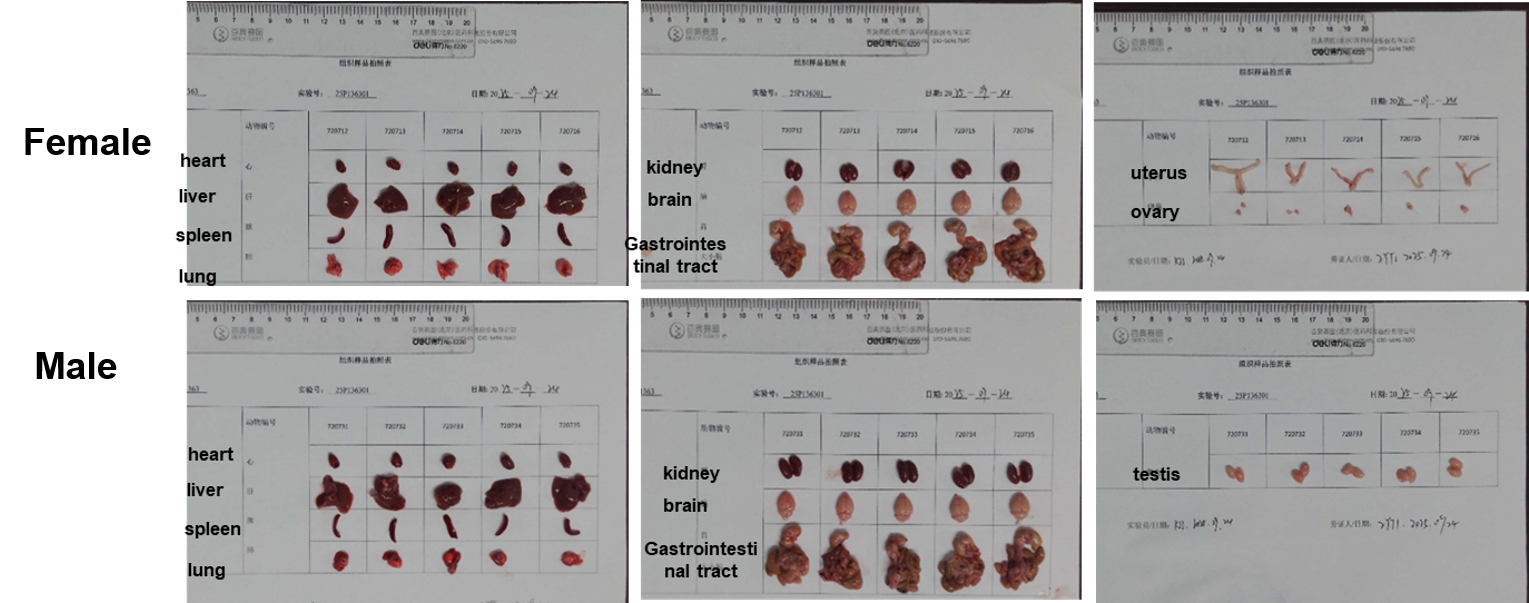
Gross Anatomy of B-hTREM1 mice
The organs of B-hTREM1 mice (7-week-old, n=5).
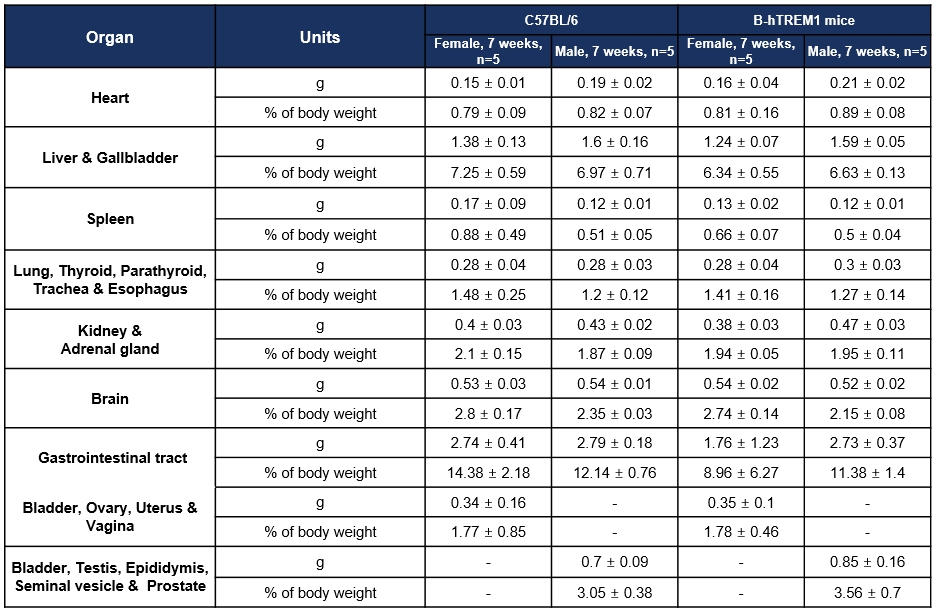
Organ Weight and Coefficient-7W
Values are expressed as mean ± SD.
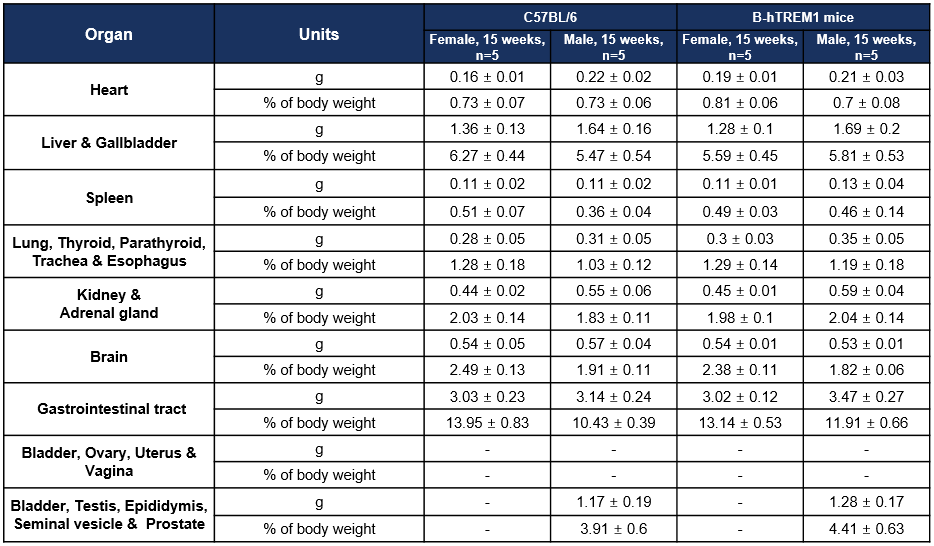
Organ Weight and Coefficient-15W
Values are expressed as mean ± SD.
Note: the female reproductive system were not weighed as a whole in 15 weeks.
* When publishing results obtained using this animal model, please acknowledge the source as follows: The animal model [B-hTREM1 mice] (Cat# 111180) was purchased from Biocytogen.