

Validation
Application
This product is utilized to evaluate the pharmacodynamics and safety of therapeutic agents targeting tumors and neurodegenerative diseases, and to assess potential of drugs to cross the BBB.

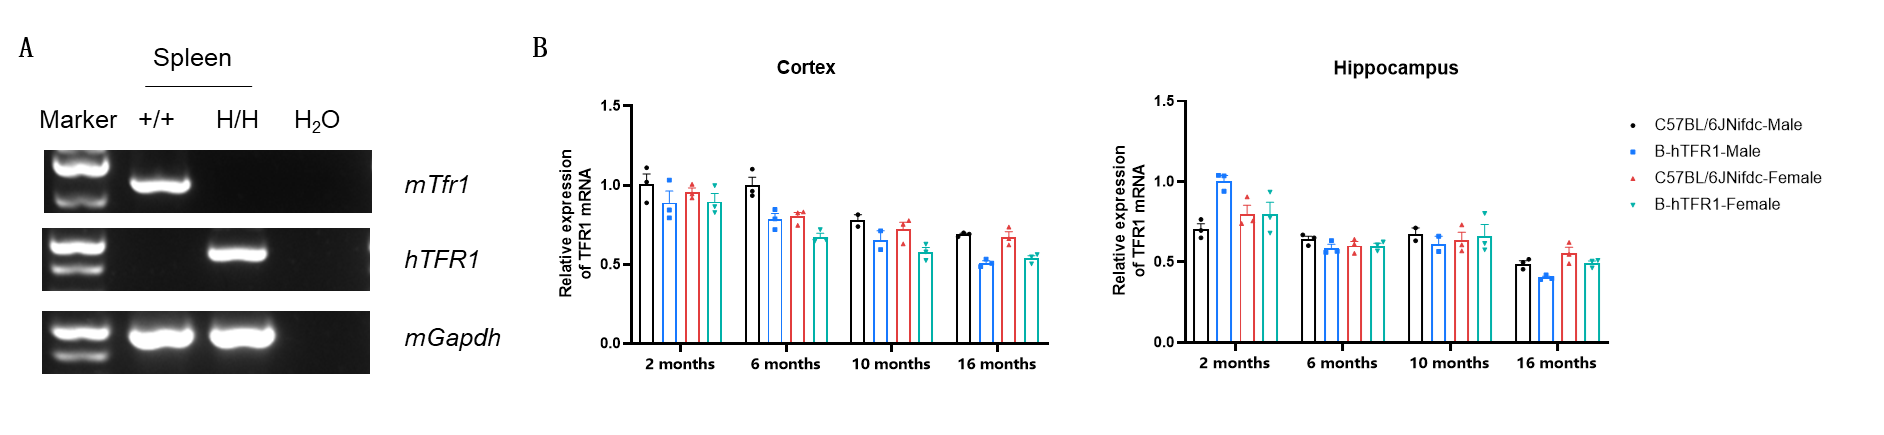
Strain-specific TFR1 expression analysis in wild-type C57BL/6 mice and homozygous TFR1 humanized mice. (A) Spleen RNA were isolated from wild-type C57BL/6 mice (+/+) and homozygous TFR1 humanized mice (H/H), then cDNA libraries were synthesized by reverse transcription, followed by PCR with mouse or human TFR1 primers. (B) Quantitative real-time PCR (qRT-PCR) analysis of relative TFR1 mRNA expression in the cortex (left) and hippocampus (right) of male and female wild-type C57BL/6JNifdc mice and homozygous B-hTFR1 mice at 2, 6, 10, and 16 months of age. Expression levels were normalized to TFR1 expression in cortex of 2-month-old C57BL/6JNifdc male mice. Values are expressed as mean ± SEM.
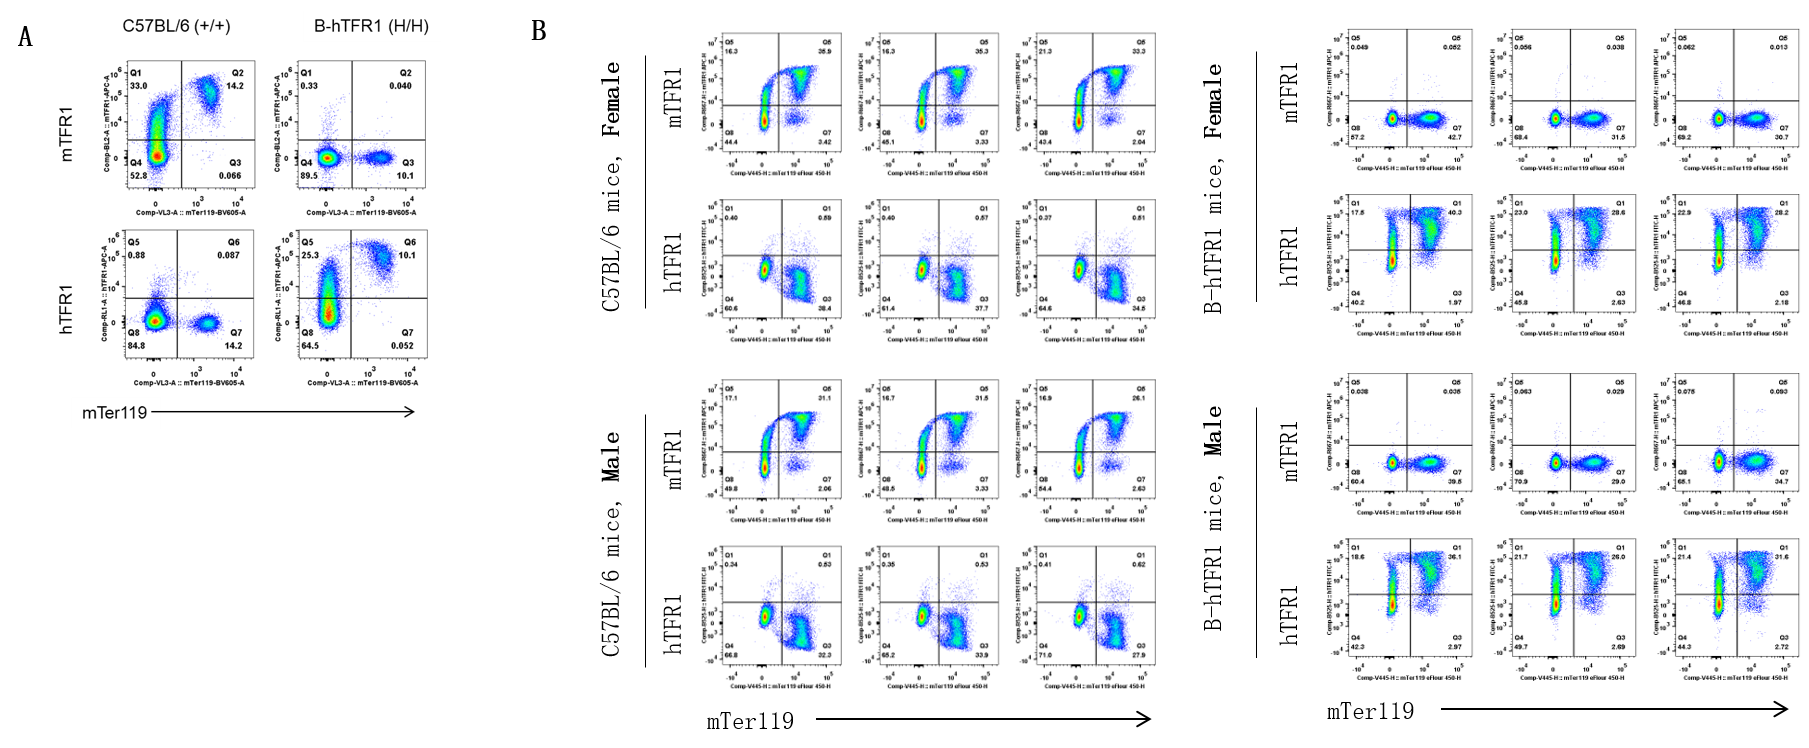
Strain-specific TFR1 expression analysis in wild-type C57BL/6 mice and homozygous TFR1 humanized mice. Bone marrow erythrocytes were collected from wild-type C57BL/6 mice (+/+) and homozygous TFR1 humanized mice (H/H). Protein expression was analyzed with anti-mouse TFR1 antibody (Biolegend, 113807) and anti-human TFR1 antibody (Biolegend, 334107) by flow cytometry.
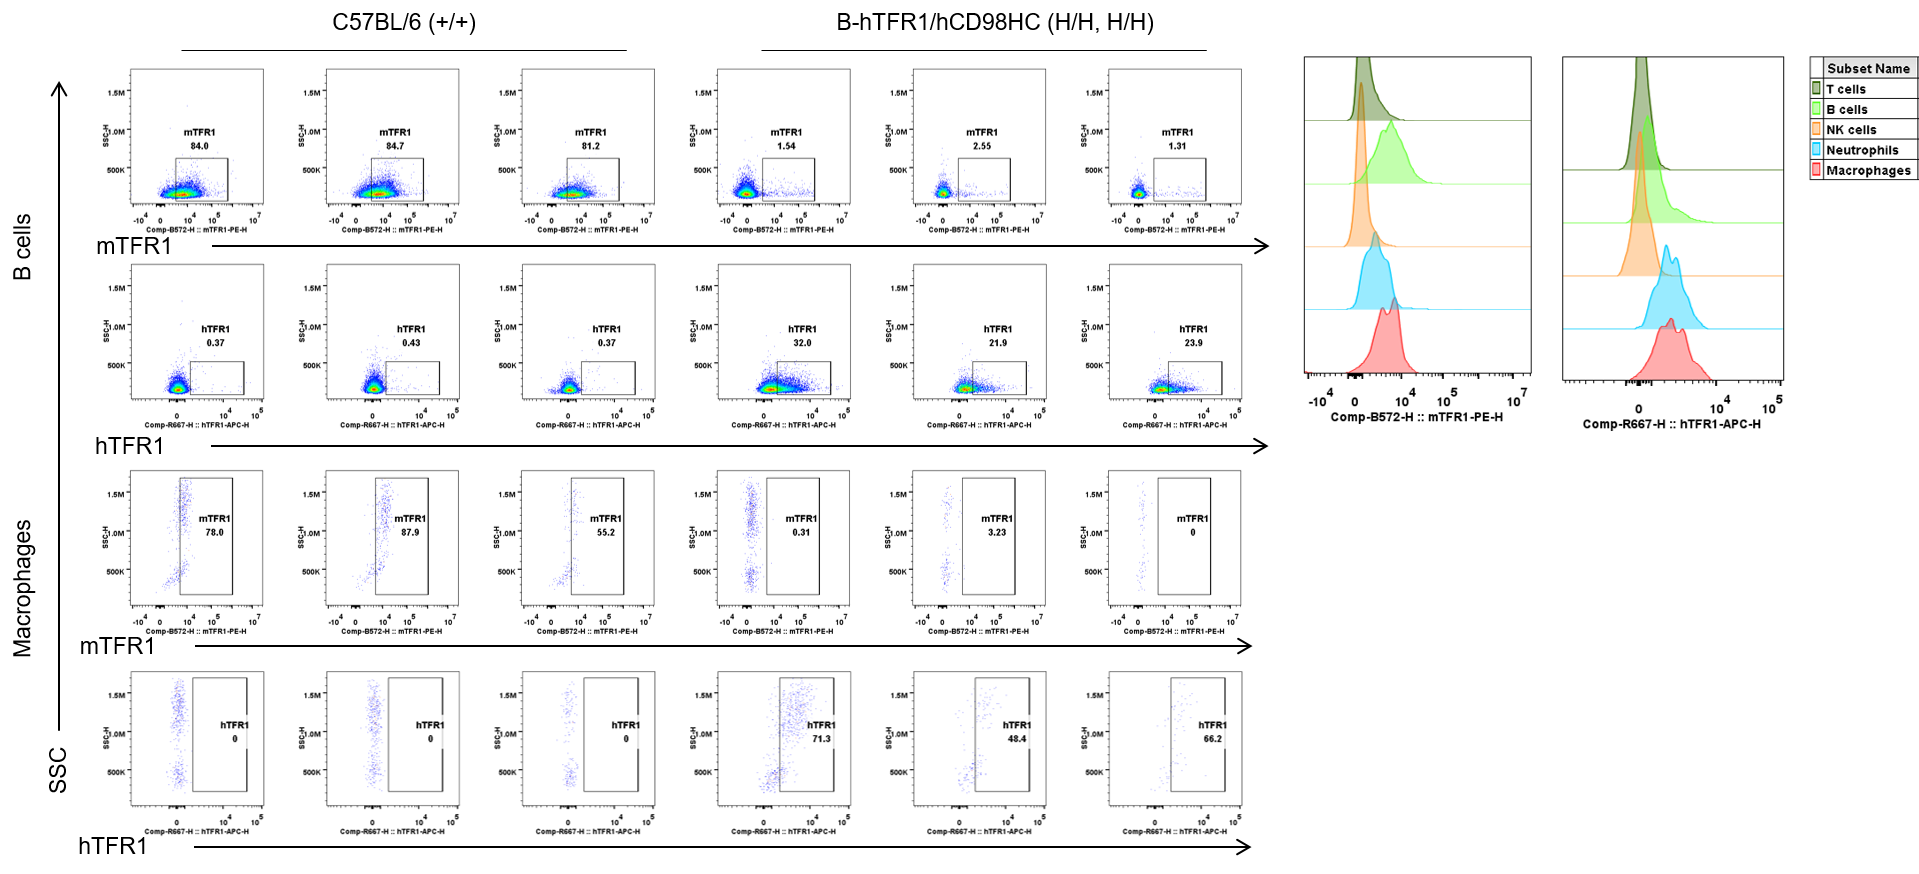
Strain specific TFR1 expression analysis in wild-type C57BL/6 and homozygous TFR1/CD98HC humanized mice by flow cytometry. Blood cells were collected from wild-type C57BL/6 (+/+) and homozygous TFR1/CD98HC humanized mice (H/H, H/H) and analyzed by flow cytometry with anti-mouse TFR1 antibody (Biolegend, 113808) and anti-human TFR1 antibody (Biolegend, 334108). mTFR1 was only detectable in wild-type mice, and hTFR1 was exclusively detectable in B cells and macrophages from homozygous mice but not from wild-type mice.
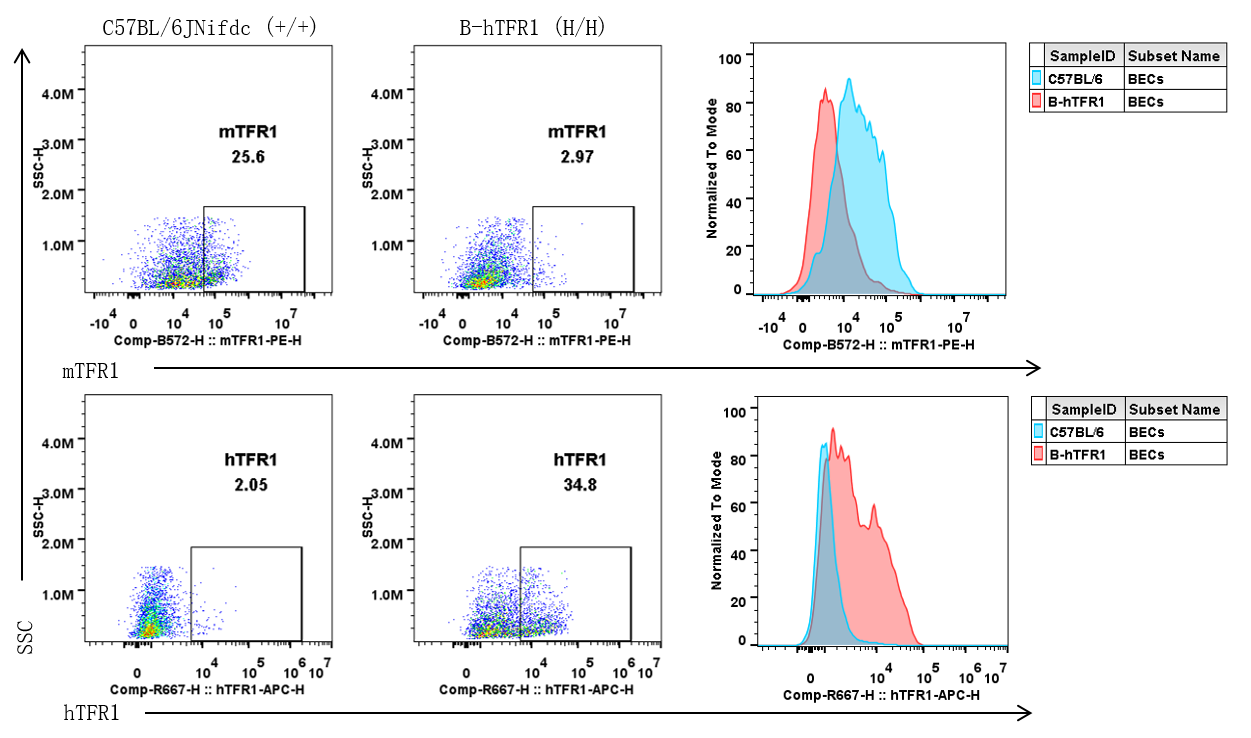
Strain specific TFR1 expression analysis in wild-type C57BL/6JNifdc and homozygous TFR1 humanized mice by flow cytometry. Brain cells were collected from wild-type C57BL/6JNifdc (+/+) and homozygous TFR1 humanized mice (H/H), and analyzed by flow cytometry with anti-mouse TFR1 antibody (Biolegend, 113808) and anti-human TFR1 antibody (Biolegend, 334108).
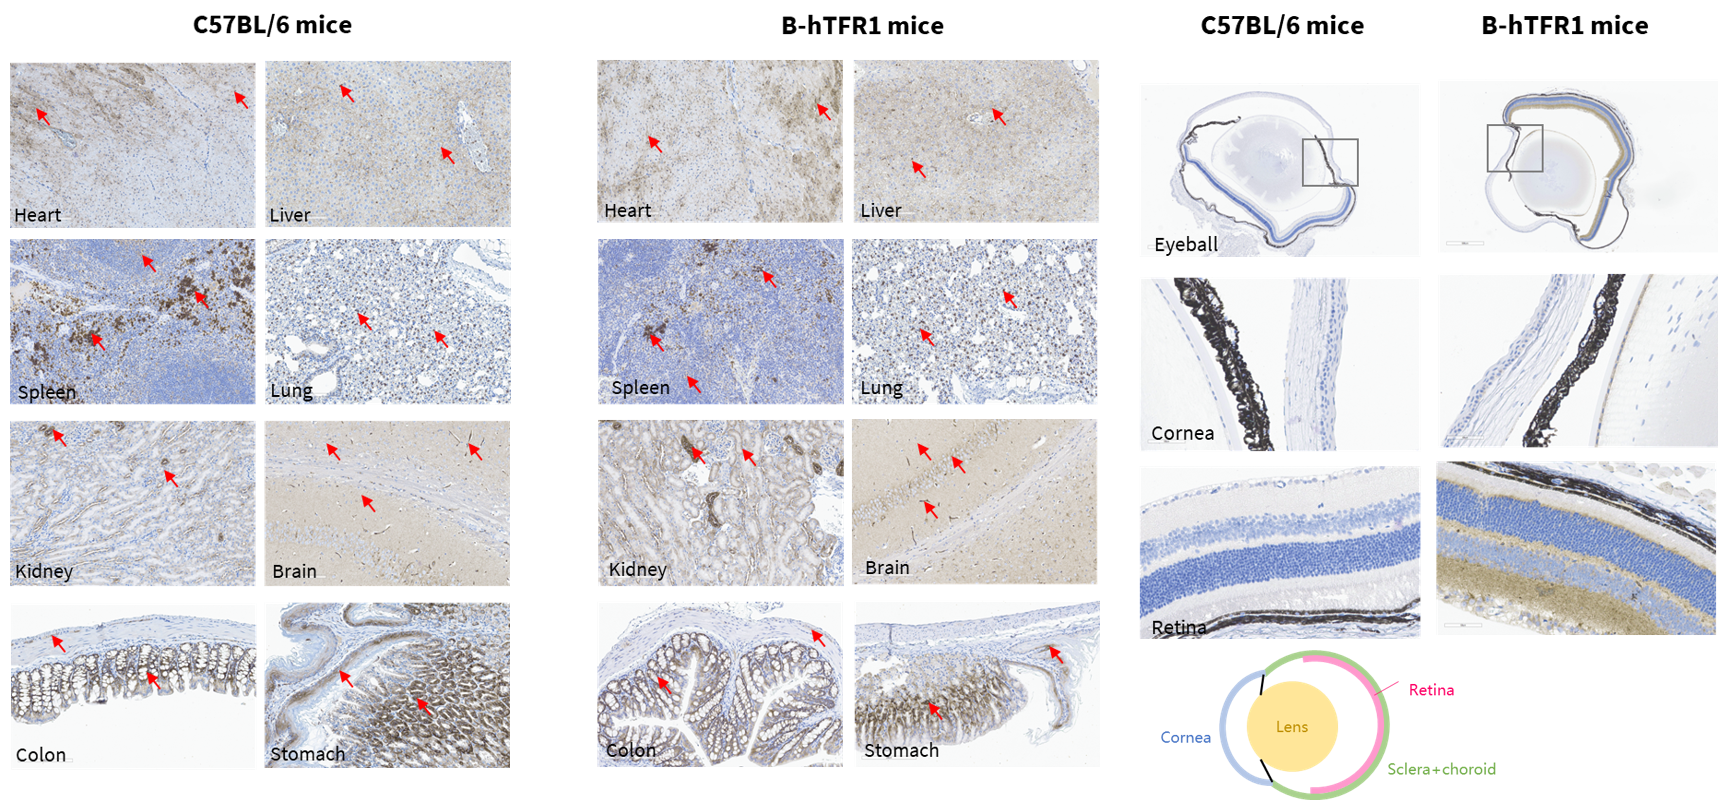
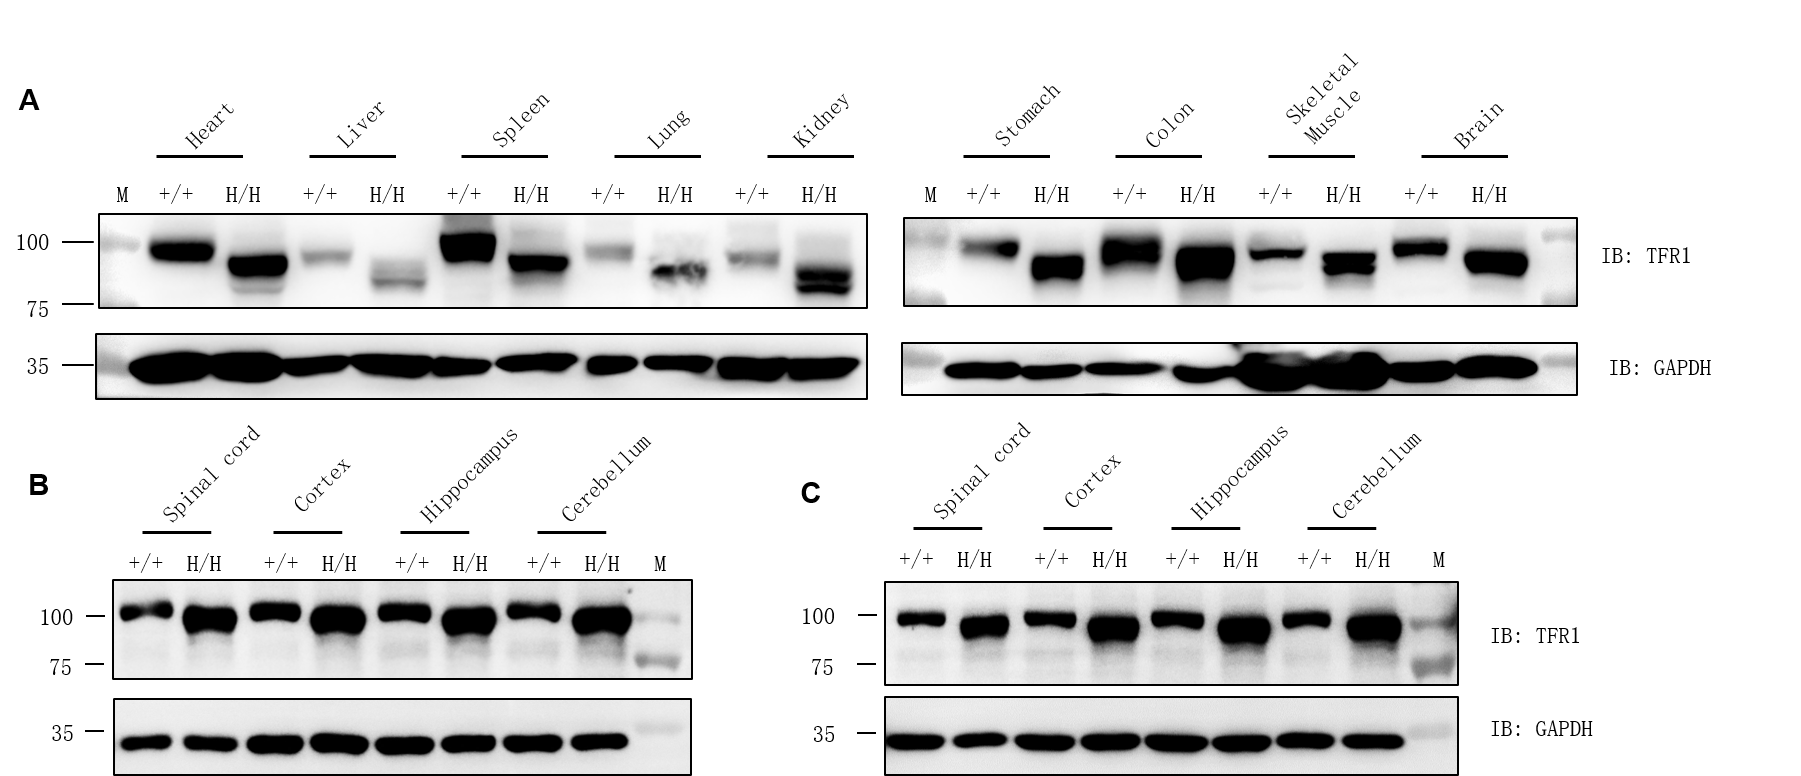
TFR1 protein expression analysis by western blotting using a cross-reactive anti-TFR1 antibody (abcam, ab214039). M, marker. (B) Male. (C) Female.
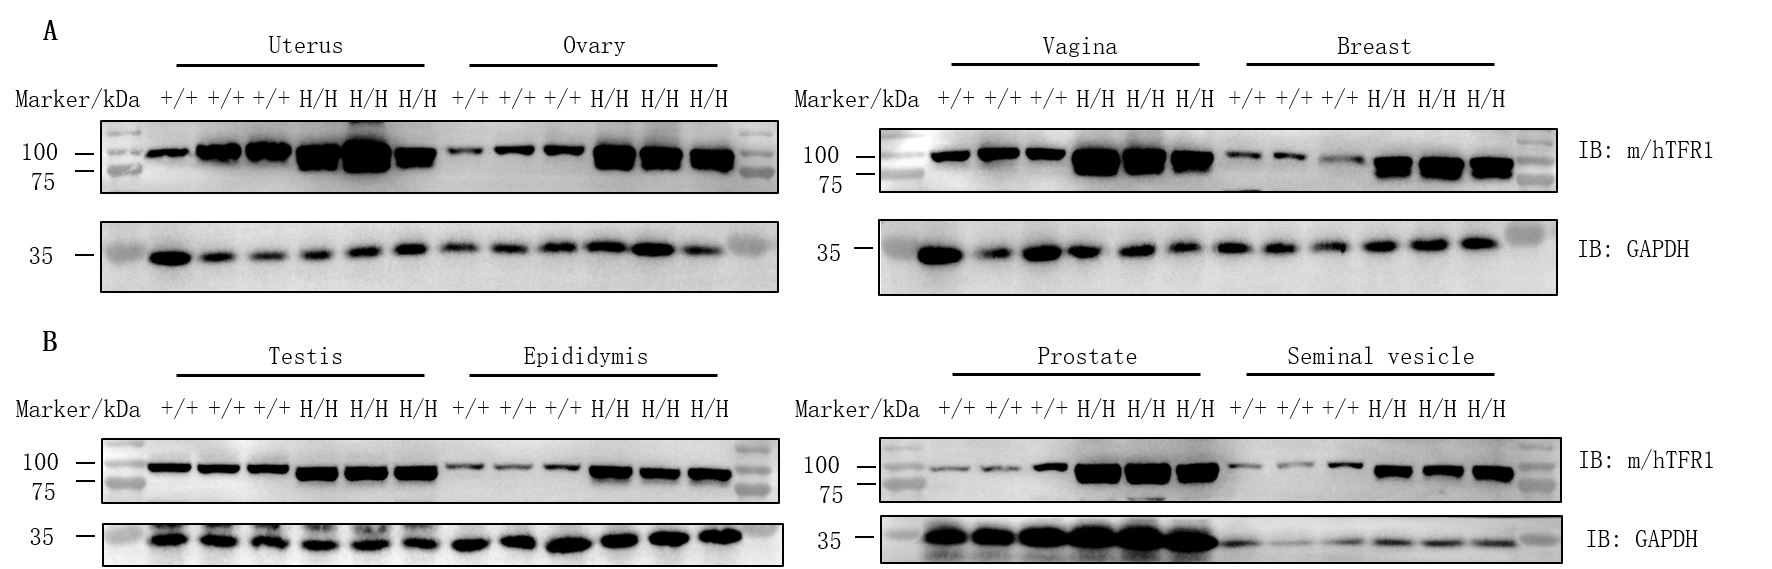
Protein expression analysis of TFR1 in homozygous TFR1/CD98HC humanized mice. Various tissue lysates were collected from wild-type C57BL/6JNifdc mice (+/+) and homozygous TFR1/CD98HC humanized mice (H/H), and then analyzed by western blot with anti-transferrin receptor antibody (abcam, ab214039) and anti-CD98 antibody (abcam, ab307587). 30 μg total proteins were loaded for western blotting analysis. TFR1 was detected in uterus, ovary, vagina, breast, testis, epididymis, prostate and seminal vesicle from both wild-type C57BL/6JNifdc mice and homozygous B-hTFR1/hCD98HC mice, as the antibody was cross-reactive between human and mouse.
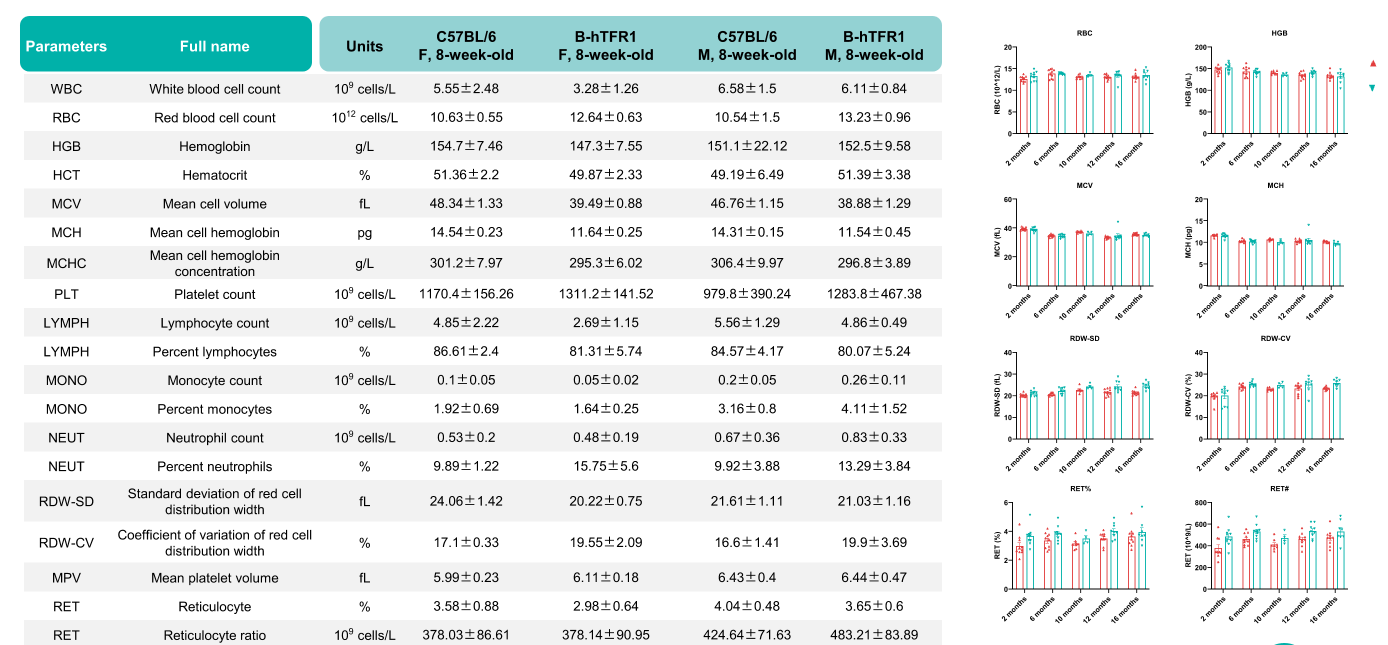
Values are expressed as mean ± SD.
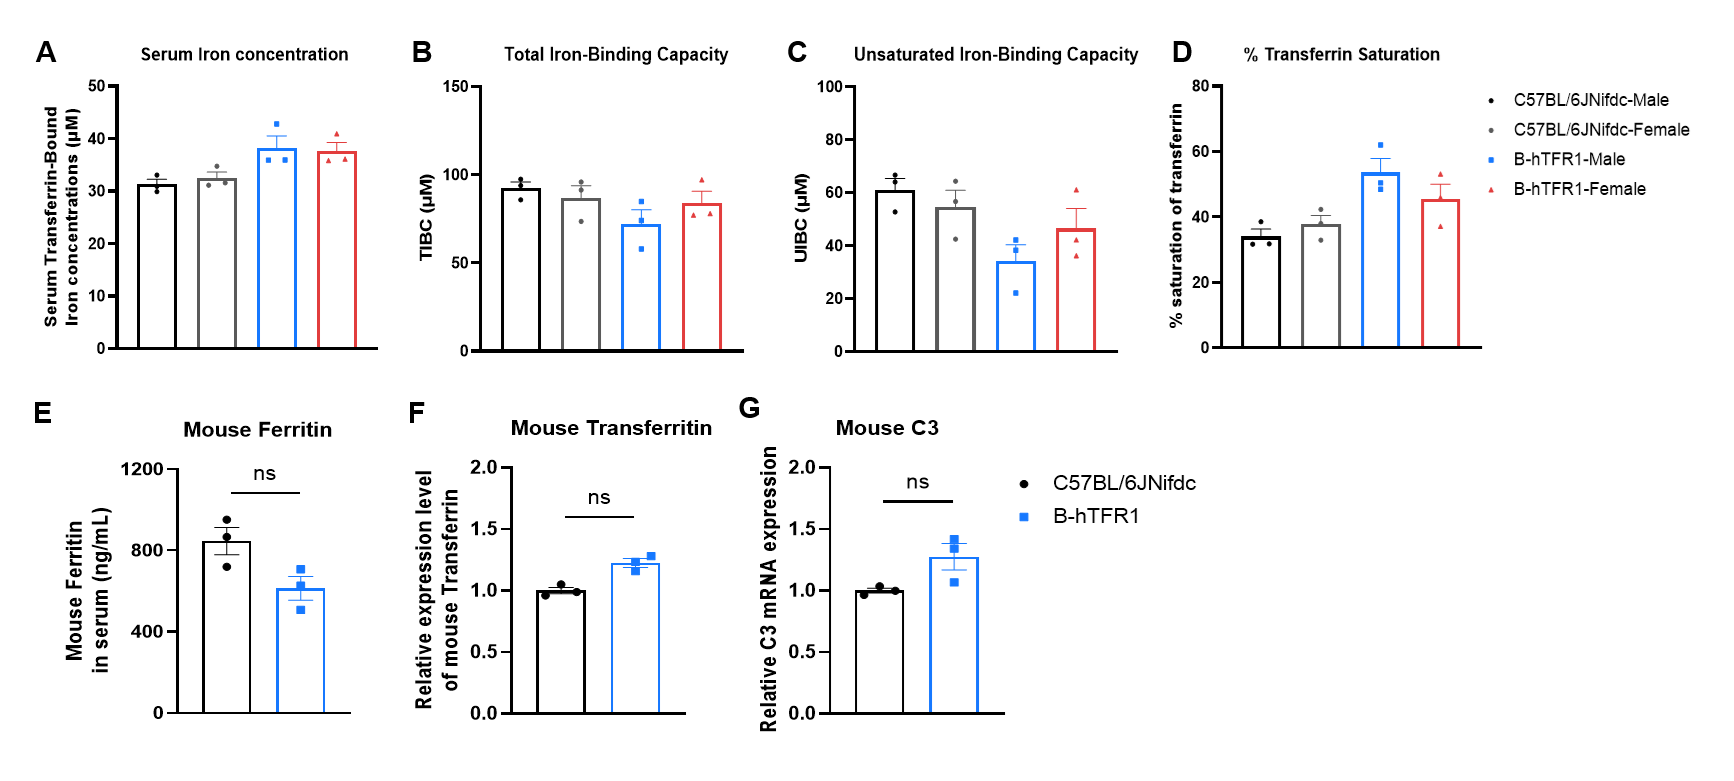
Serum iron homeostasis assay in wild-type C57BL/6JNifdc and homozygous humanized TFR1 humanized mice. (A-D) Serum were collected from C57BL/6JNifdc (female, n=3; male, n=3; 14-week-old) and TFR1 humanized mice (female, n=3; male, n=3; 9-week-old), and then analyzed by Total Iron-Binding Capacity (TIBC) and Serum Iron Assay kit (abcam, ab239715). (E-G) Mouse ferritin, transferritin and complement 3 detection in wild-type C57BL/6JNifdc and TFR1 humanized mice (male, n=3, 8-week-old). Values are expressed as mean ± SEM. Significance was determined by two-way ANOVA test. *P < 0.05, **P < 0.01, ***p < 0.0001.
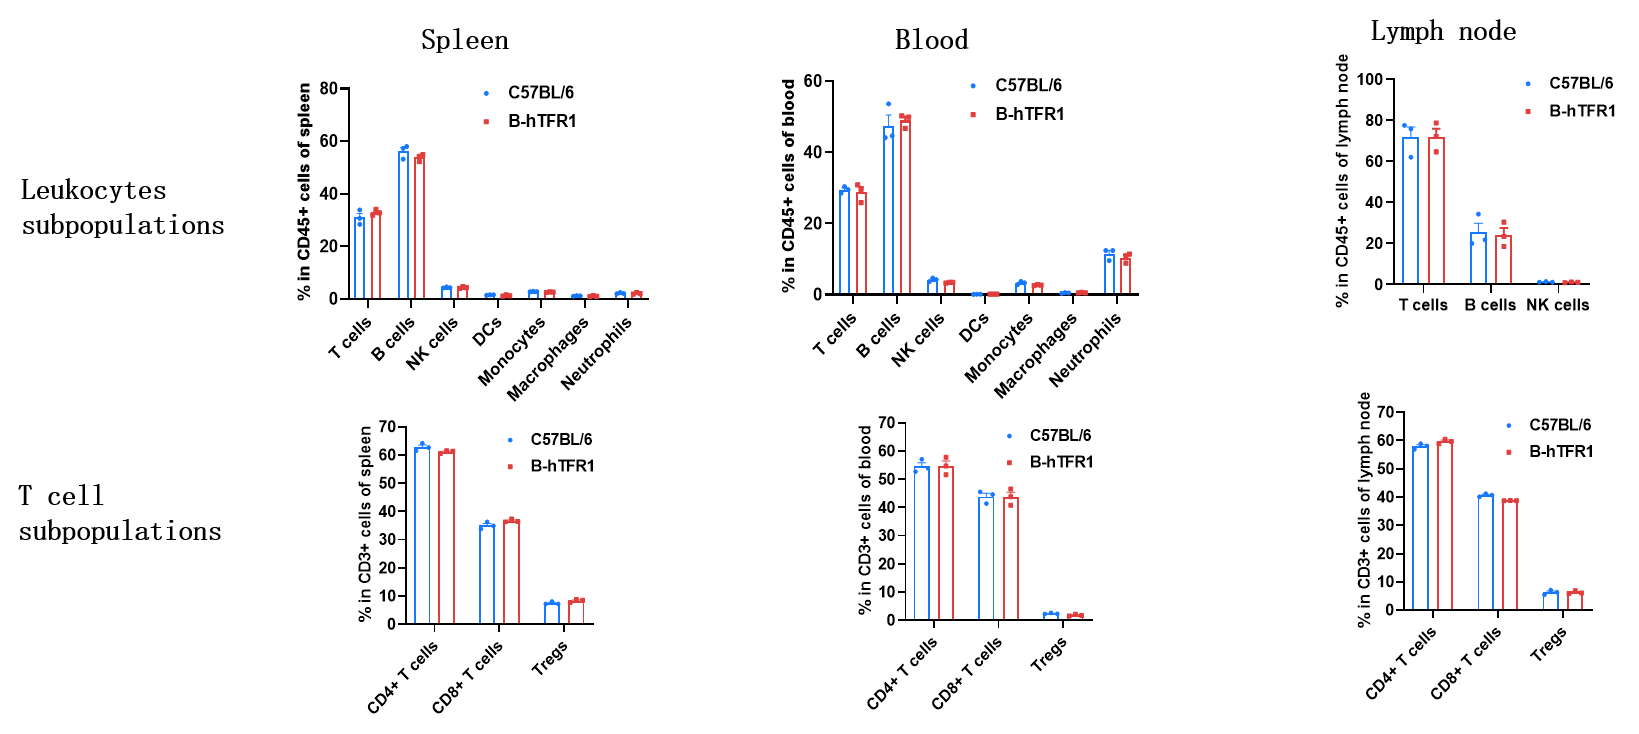
Values are expressed as mean ± SD.
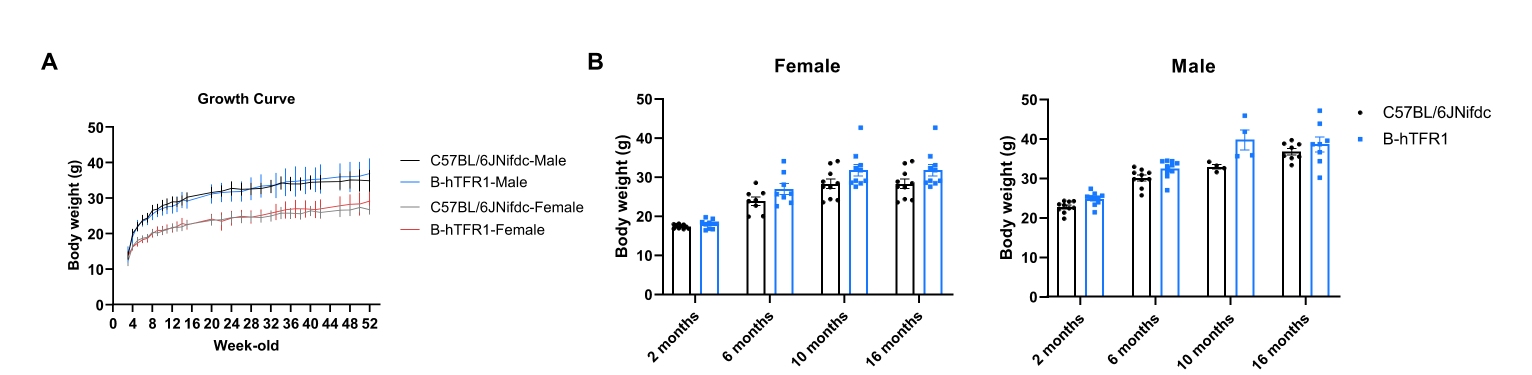
Body weight growth of TFR1 humanized mice compared with C57BL/6JNifdc mice. (A) Longitudinal body weight of male and female TFR1 humanized mice from 3 to 52 weeks of age. (B) Body weight of female and male TFR1 humanized mice at 2, 6, 10, and 16 months of age, compared with age- and sex-matched wild-type C57BL/6JNifdc mice (black bars). Values are expressed as mean ± SEM.
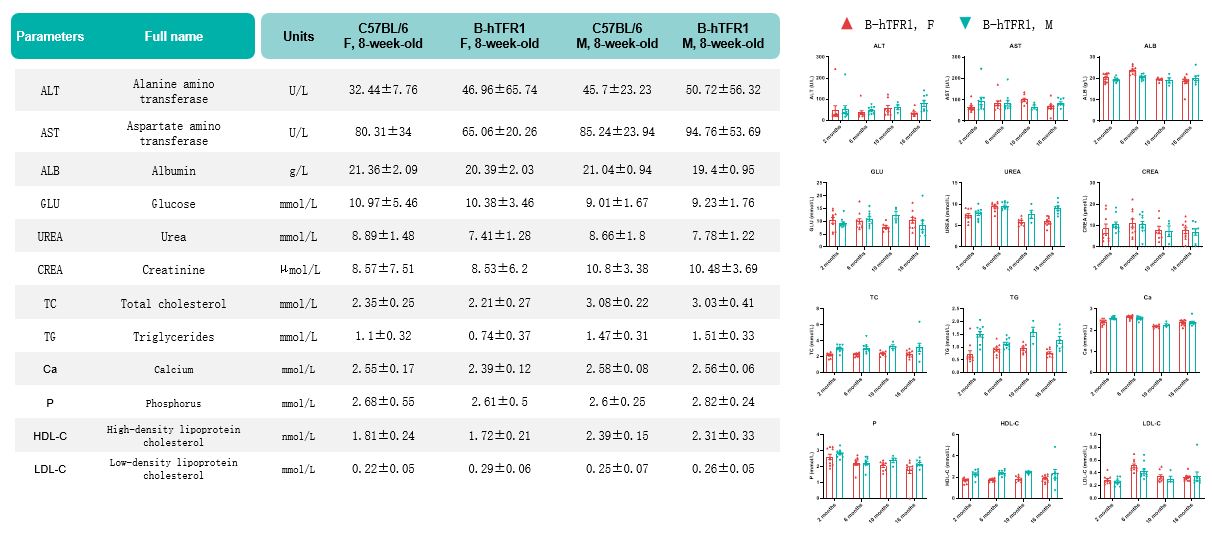
Values are expressed as mean ± SD.
No abnormal pathological findings were observed in all tissues examined in TFR1 humanized mice (female).
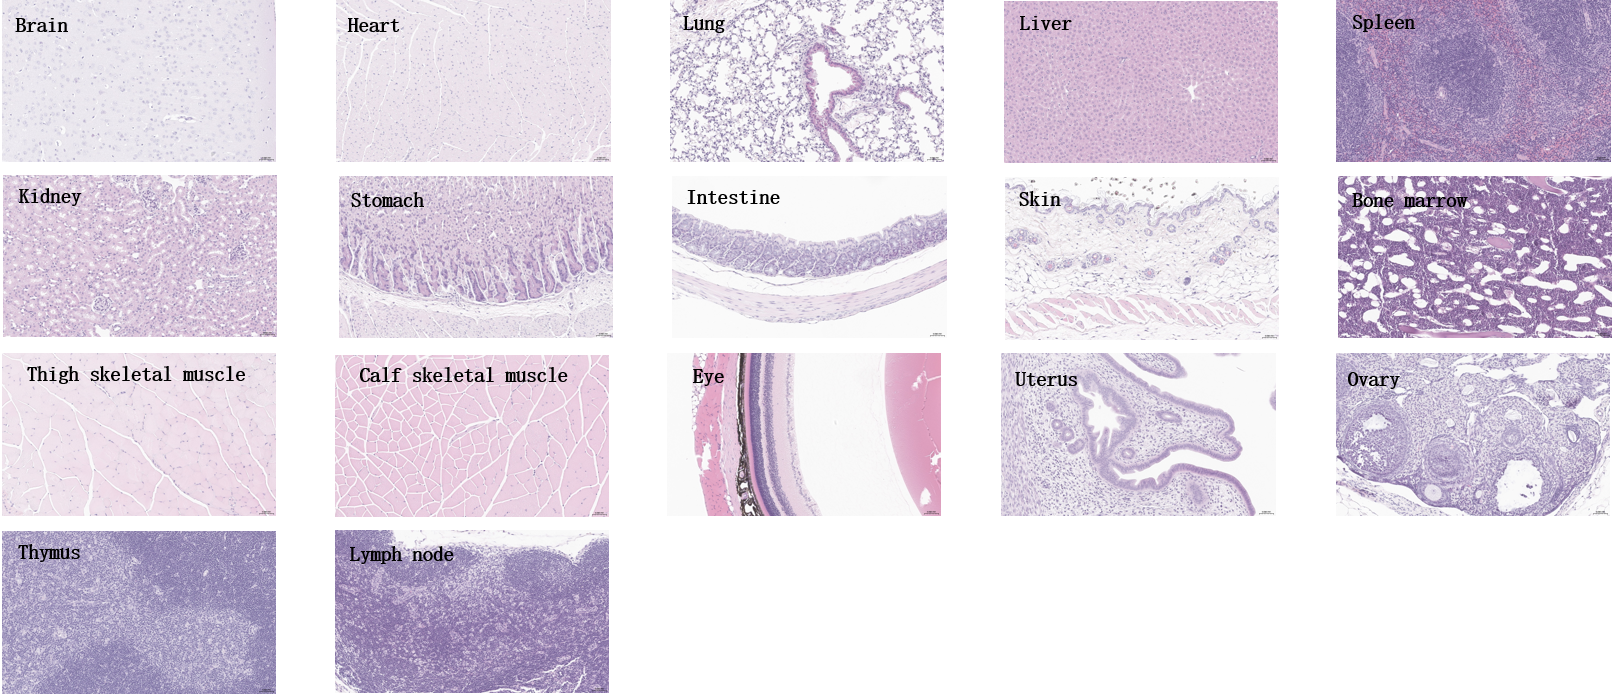
Histopathological analysis of major organs from homozygous TFR1 humanized mice. Tissues were collected from B-hTFR1 mice (female, 8-week-old, n=3), fixed in 4% paraformaldehyde and stained with hematoxylin and eosin (H&E). Representative photomicrographs are shown. Scale bar: 40x.
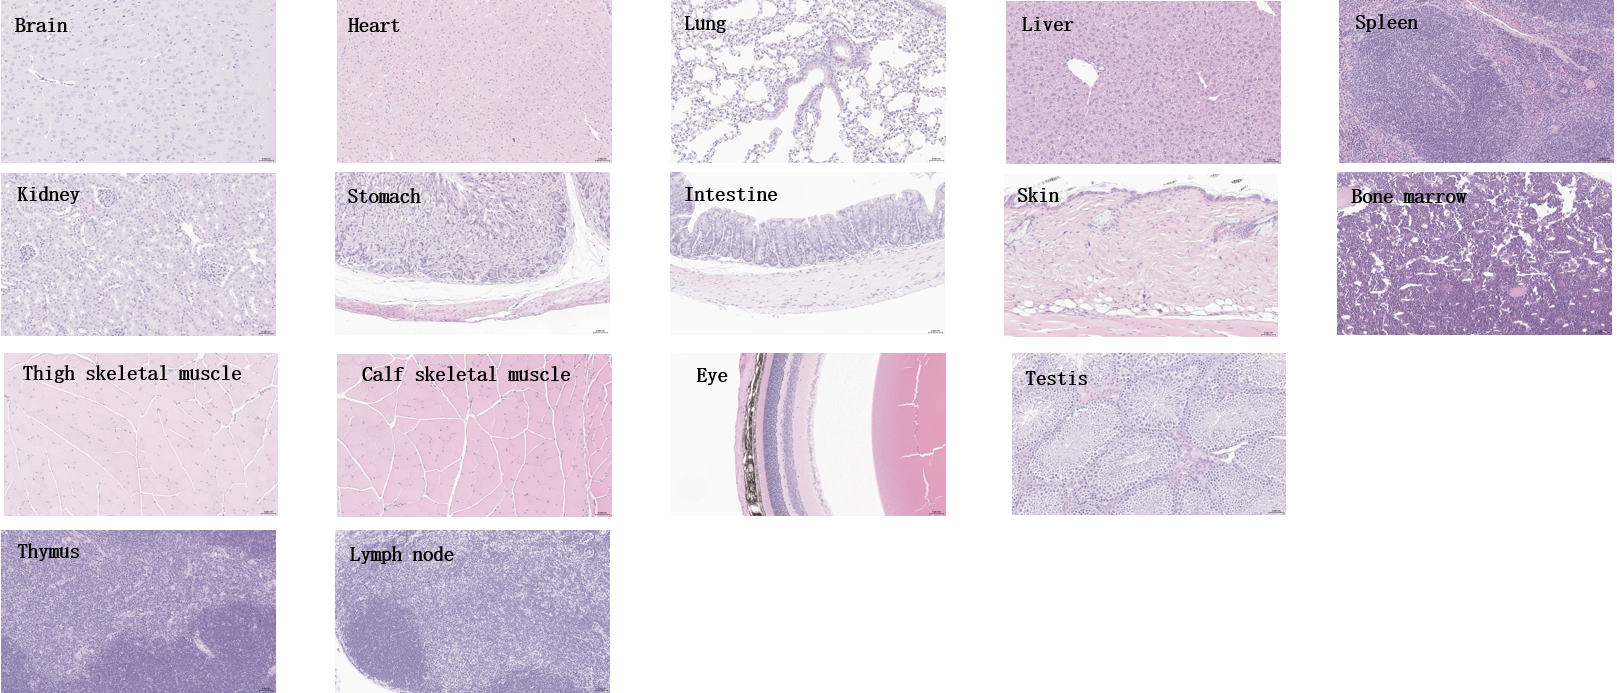
Histopathological analysis of major organs from homozygous TFR1 humanized mice. Tissues were collected from TFR1 humanized mice (male, 8-week-old, n=3), fixed in 4% paraformaldehyde and stained with hematoxylin and eosin (H&E). Representative photomicrographs are shown. Scale bar: 40x.
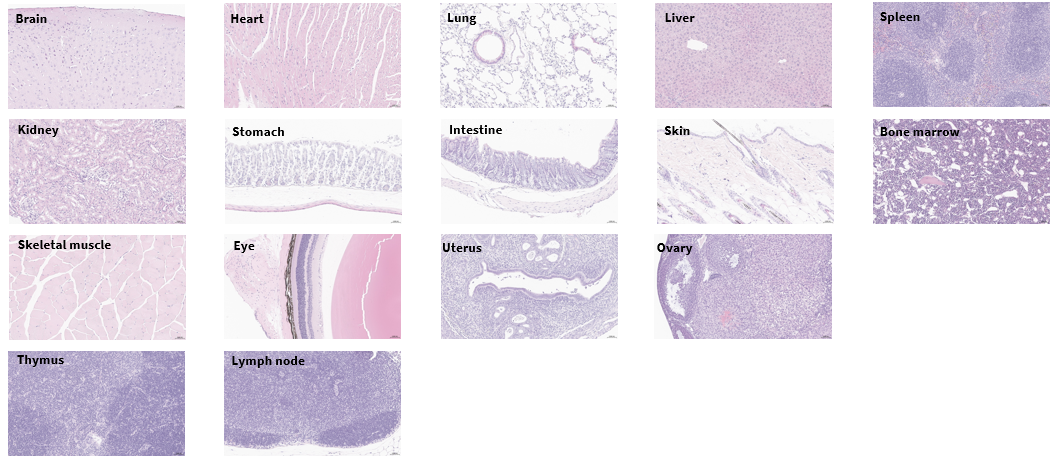
Histopathological analysis of major organs from homozygous TFR1 humanized mice. Tissues were collected from TFR1 humanized mice (female, 6-month-old, n=3), fixed in 4% paraformaldehyde and stained with hematoxylin and eosin (H&E). Representative photomicrographs are shown. Scale bar: 40x.
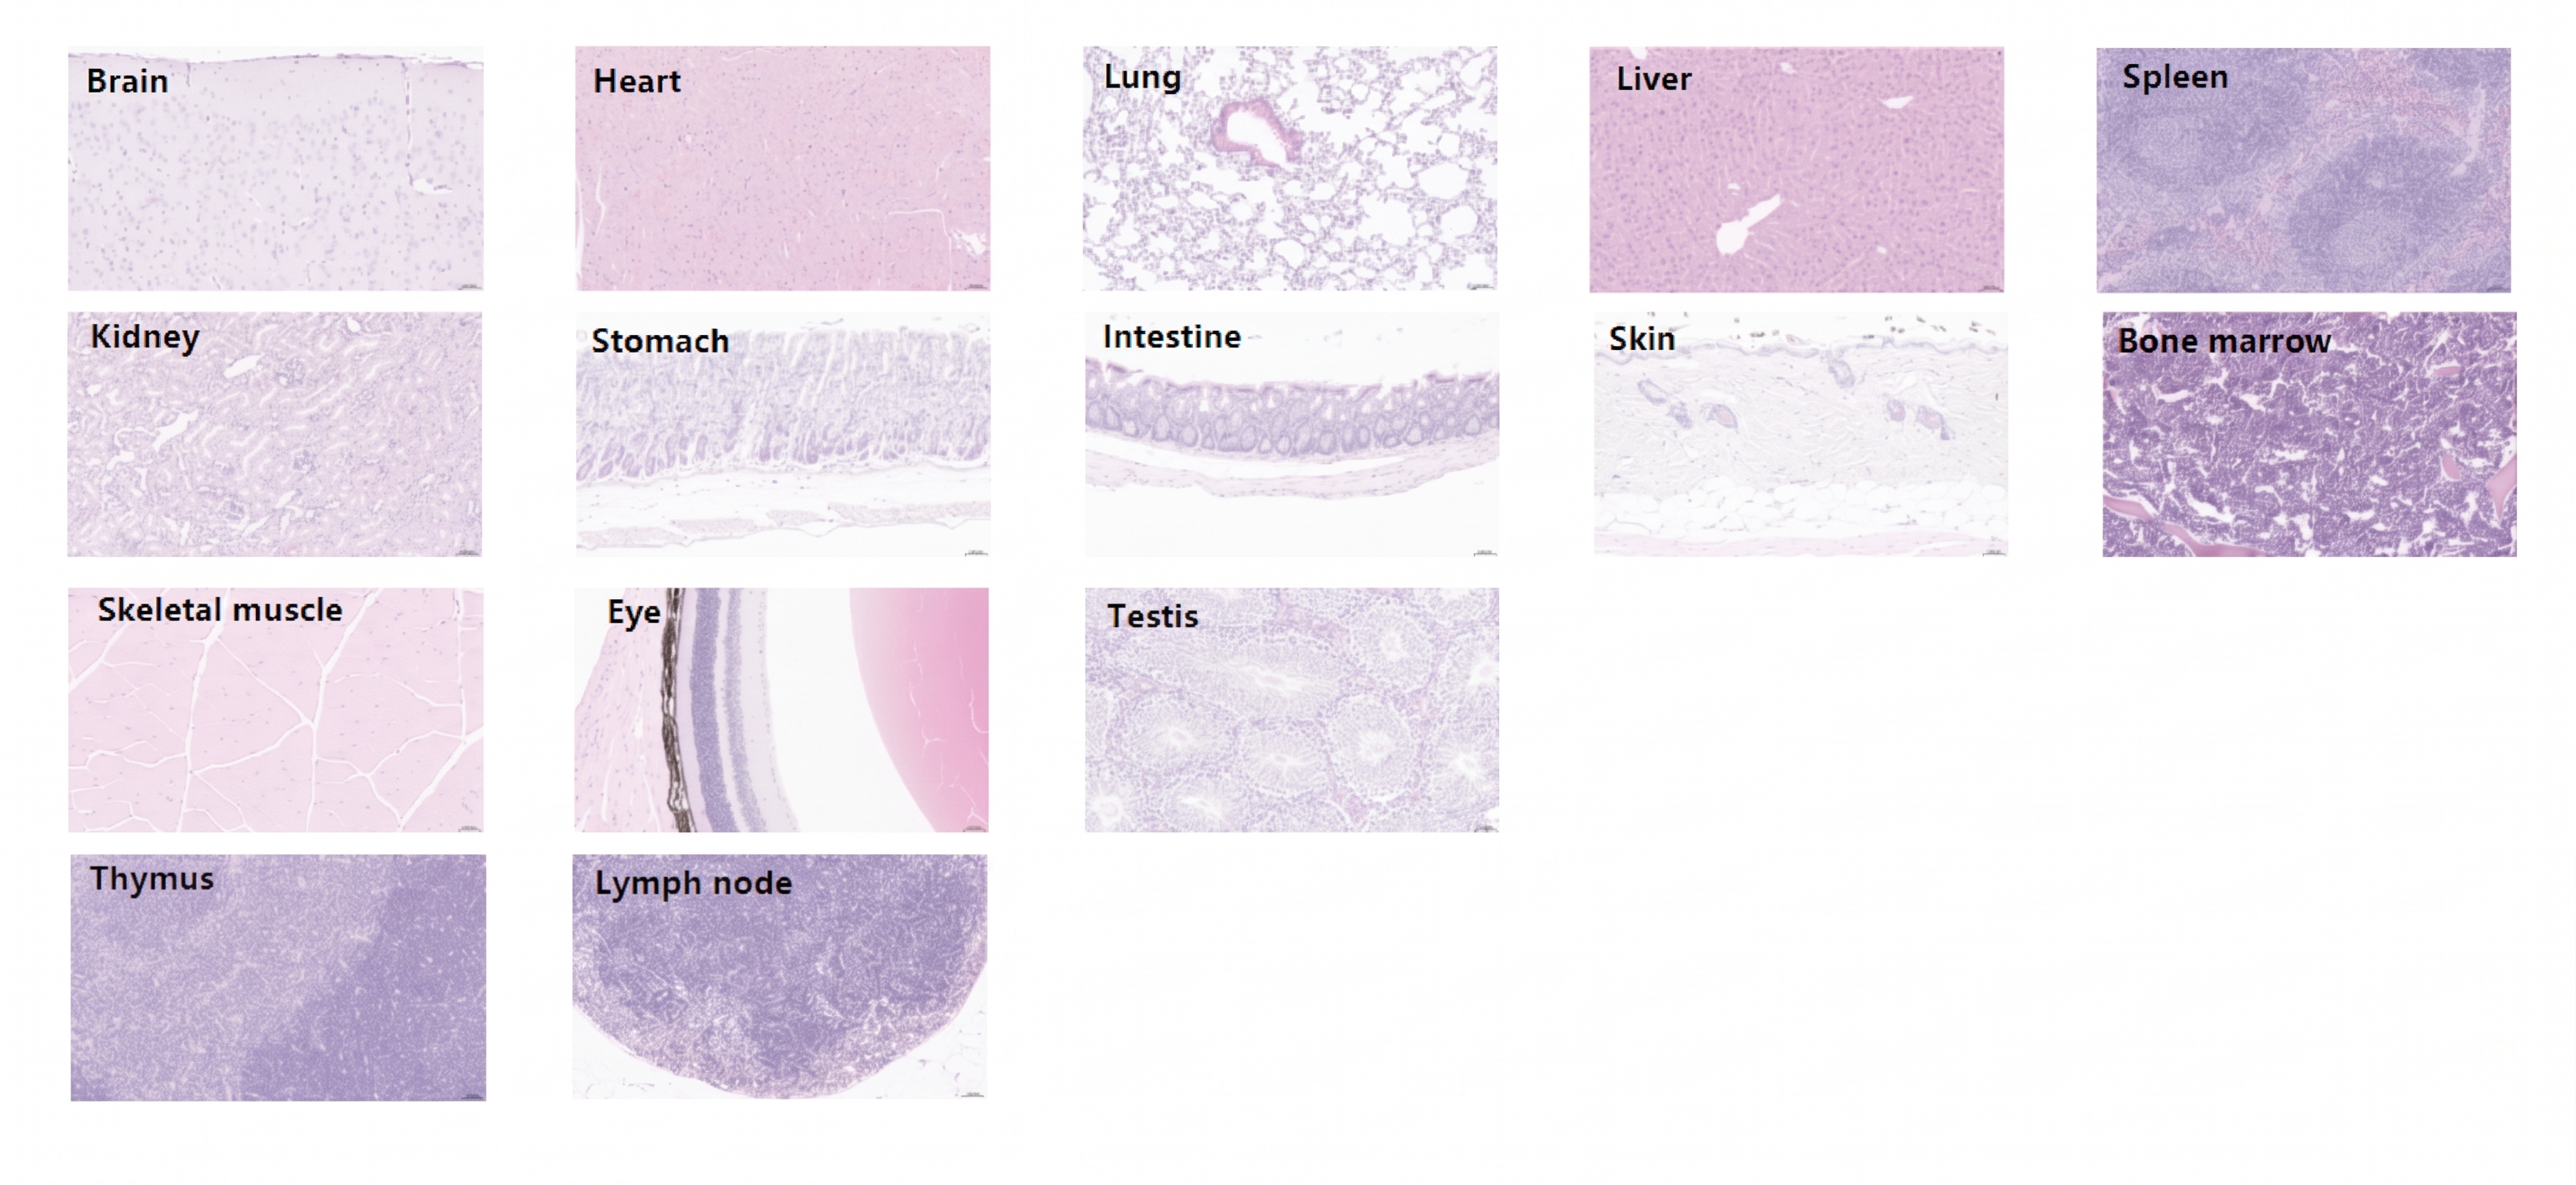
Histopathological analysis of major organs from homozygous TFR1 humanized mice. Tissues were collected from TFR1 humanized mice (male, 6-month-old, n=3), fixed in 4% paraformaldehyde and stained with hematoxylin and eosin (H&E). Representative photomicrographs are shown. Scale bar: 200x.
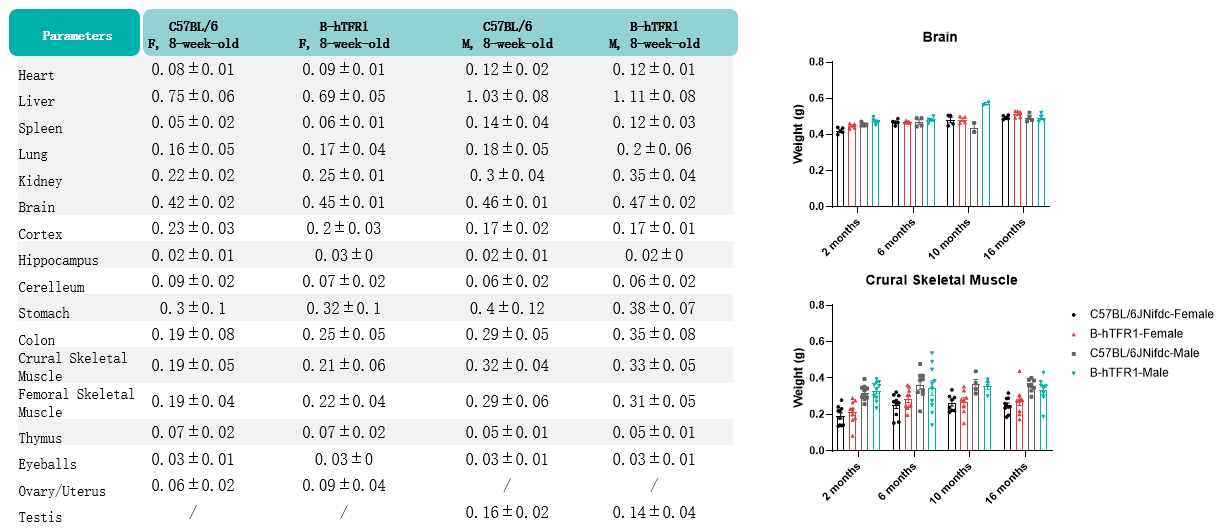
Values are expressed as mean ± SD.
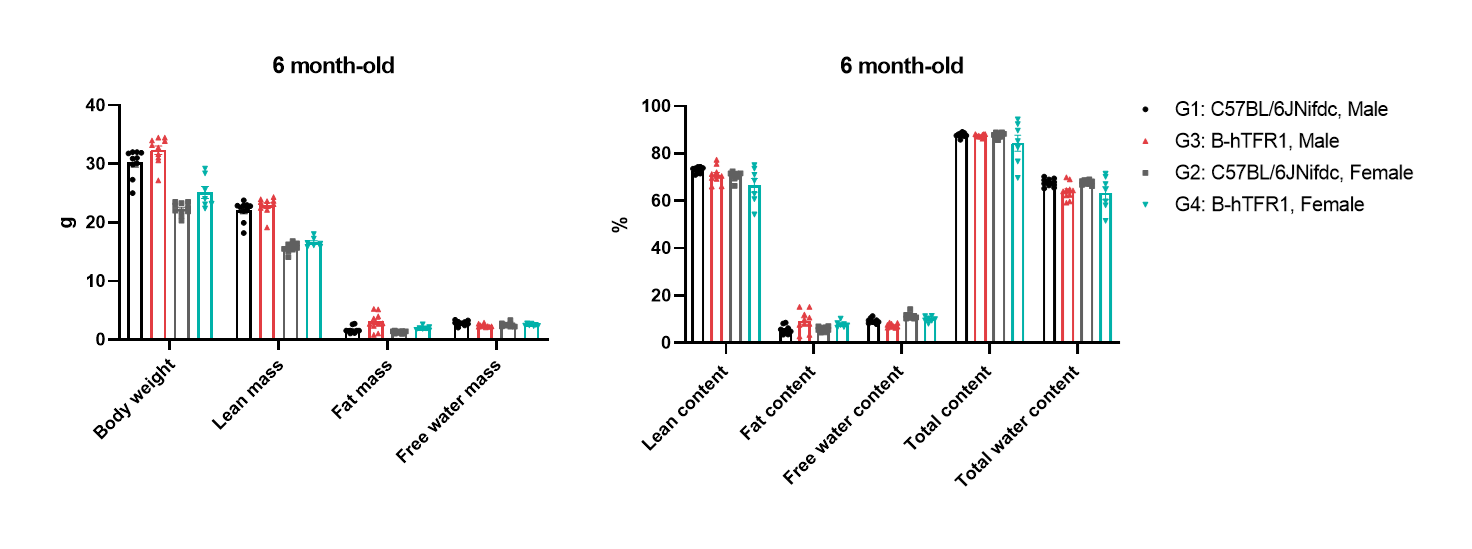
Body composition analysis of wild-type C57BL/6JNifdc mice and homozygous TFR1 humanized mice (6-month-old, n=10) measured by Body Composition Analyzer. (A) Absolute body weight, lean mass, fat mass, and free water mass (expressed in grams). (B) Relative lean content, fat content, free water content, total content, and total water content (expressed as percentages). TFR1 humanized mice exhibited normal body composition profiles with no notable differences from wild-type C57BL/6JNifdc mice.

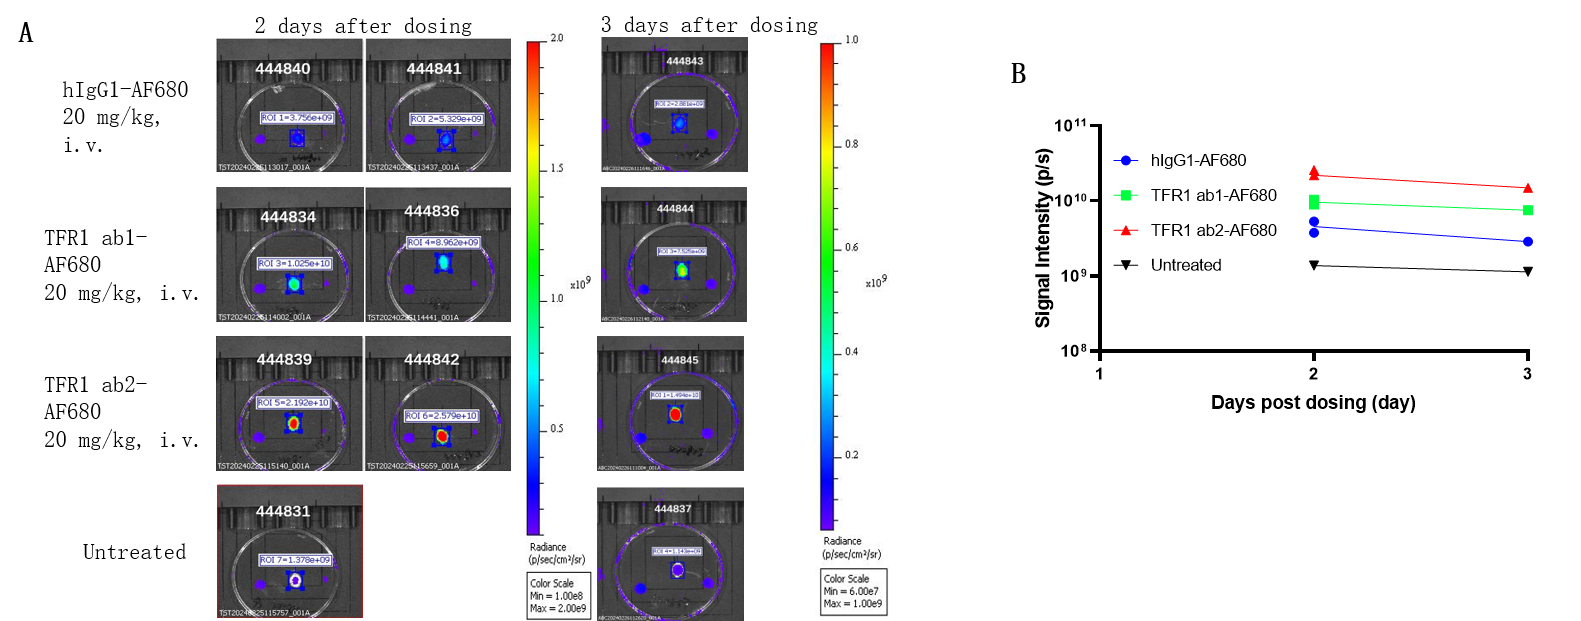
Brain uptake of anti-human TFR1 antibody Ab2 was higher than Ab1 in TFR1 humanized mice. TFR1 humanized mice were intravenously injected with AF680-conjugated control hIgG1 or anti-human TFR1 antibodies ab1 and ab2 (provided by a client). After 2 days or 3 days post-injection, the mice were perfused and their brains were collected for analysis. (A) Mouse brain images under imaging system. (B) Fluorescence intensity of mouse brain under imaging system. The results indicate that the uptake of anti-human TFR1 antibody ab2 in the brain of B-hTFR1 mice was higher than that of anti-human TFR1 antibody ab1.
Note: These data were obtained from collaborative validation with the client, who provided the antibody.
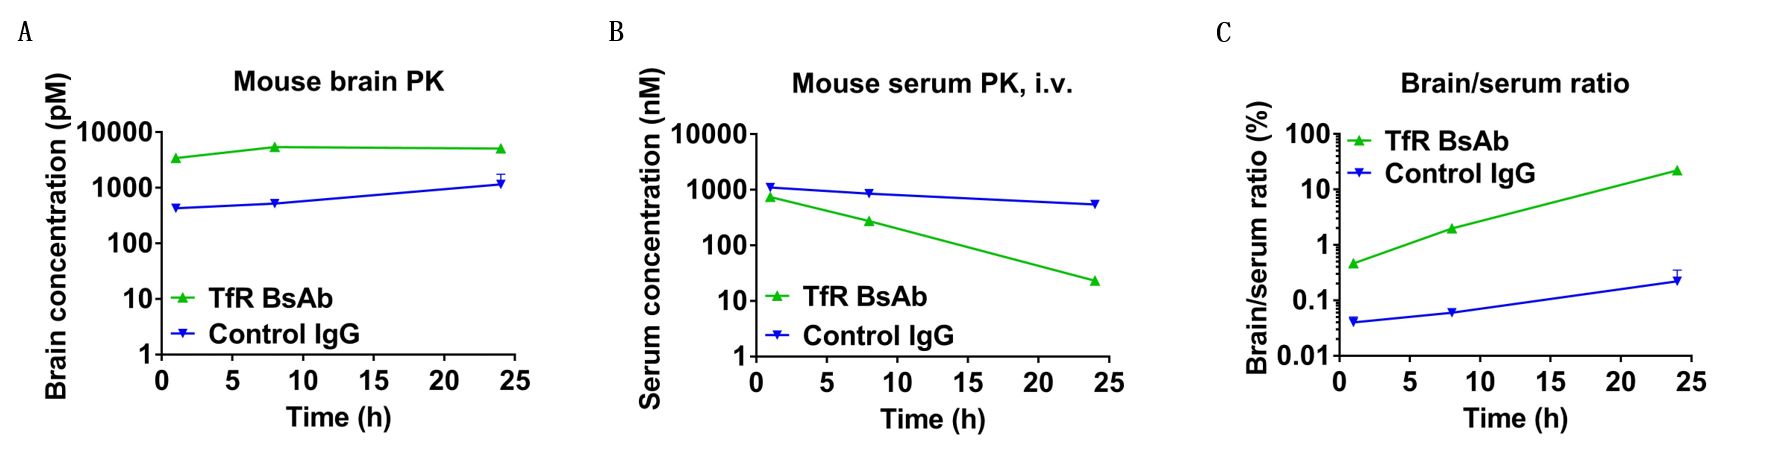
In vivo pharmacokinetic (PK) evaluation of anti-human TFR1 bispecific antibodies (BsAbs). TFR1 humanized mice were injected with control IgG (10 mpk) and anti-human TFR1 BsAbs (10.9 mpk) provided by a client via tail vein. Brain and serum were taken for in vivo PK evaluation. Brain concentrations(A), serum concentrations (B), and brain-to-serum ratio (C) of anti-human TFR1 BsAbs were quantified. As shown in panel, anti-human TFR1 BsAbs exhibited higher serum clearance and enhanced brain exposure after dose. The results confirmed that brain of TFR1 humanized mice enables uptake of an intravenously administered anti-human TFR1 BsAbs and TFR1 humanized mice provide a powerful preclinical model for in vivo evaluation of effective delivery of protein therapeutics to the central nervous system (CNS). Graphs represent mean ± SEM.
Note: This experiment was performed by the client using B-hTFR1 mice. All the other materials were provided by the client.
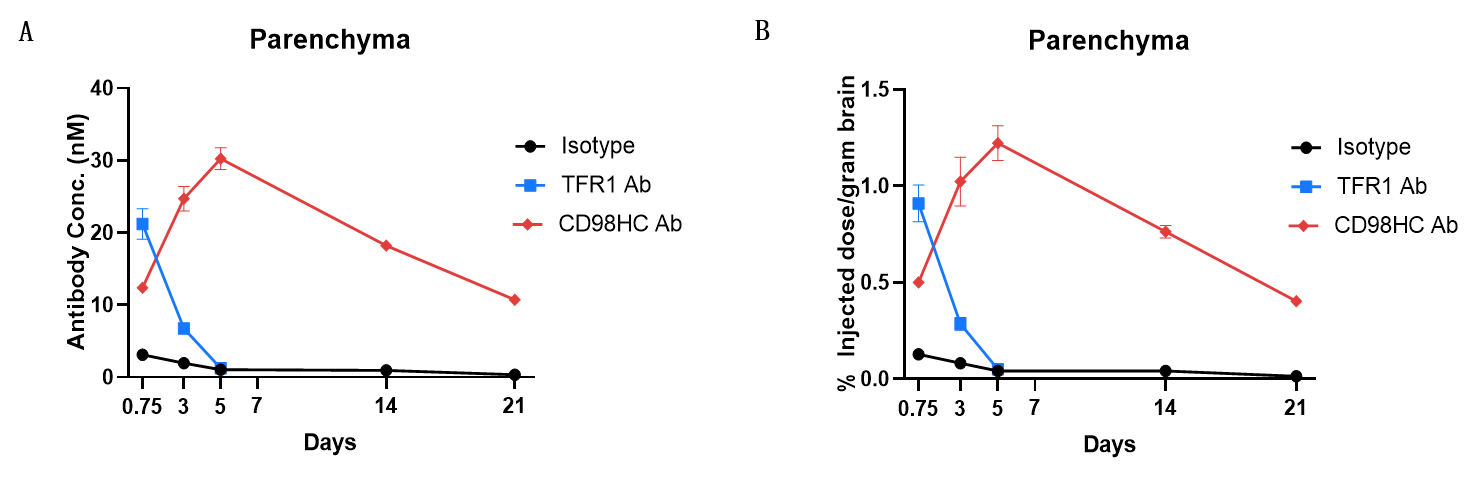
In vivo PK evaluation and comparison of anti-human TFR1 and anti-CD98HC antibody. TFR1/CD98HC humanized mice (n=2, female, 8-week-old) were injected with control IgG (10 mpk) anti-human TFR1 antibody (TFR1 Ab, JR-141 analog, monovalent, produced in house, 12.56 mpk) and anti-human CD98HC antibody (CD98HC Ab, CD98BBBB-h1.L analog, monovalent, produced in house, 13.3 mpk) via tail vein. Brain were taken for in vivo PK evaluation after dosing 18 h and 3, 5, 14, 21 days. Brain concentrations (A) and % of injection/gram brain (B) were quantified. As shown in panel, anti-human TFR1 antibody exhibited higher brain exposure in 18 h after dose, while anti-CD98HC antibody exhibited higher brain exposure in 72 h after dose. The results confirmed that TFR1/CD98HC humanized mice enables uptake of an intravenously administered anti-human TFR1 antibody or anti-human CD98HC antibody, and this mice can be used for the comparison of penetration efficacy of shuttle molecules targeting TFR1 or CD98HC. Graphs represent mean ± SEM.
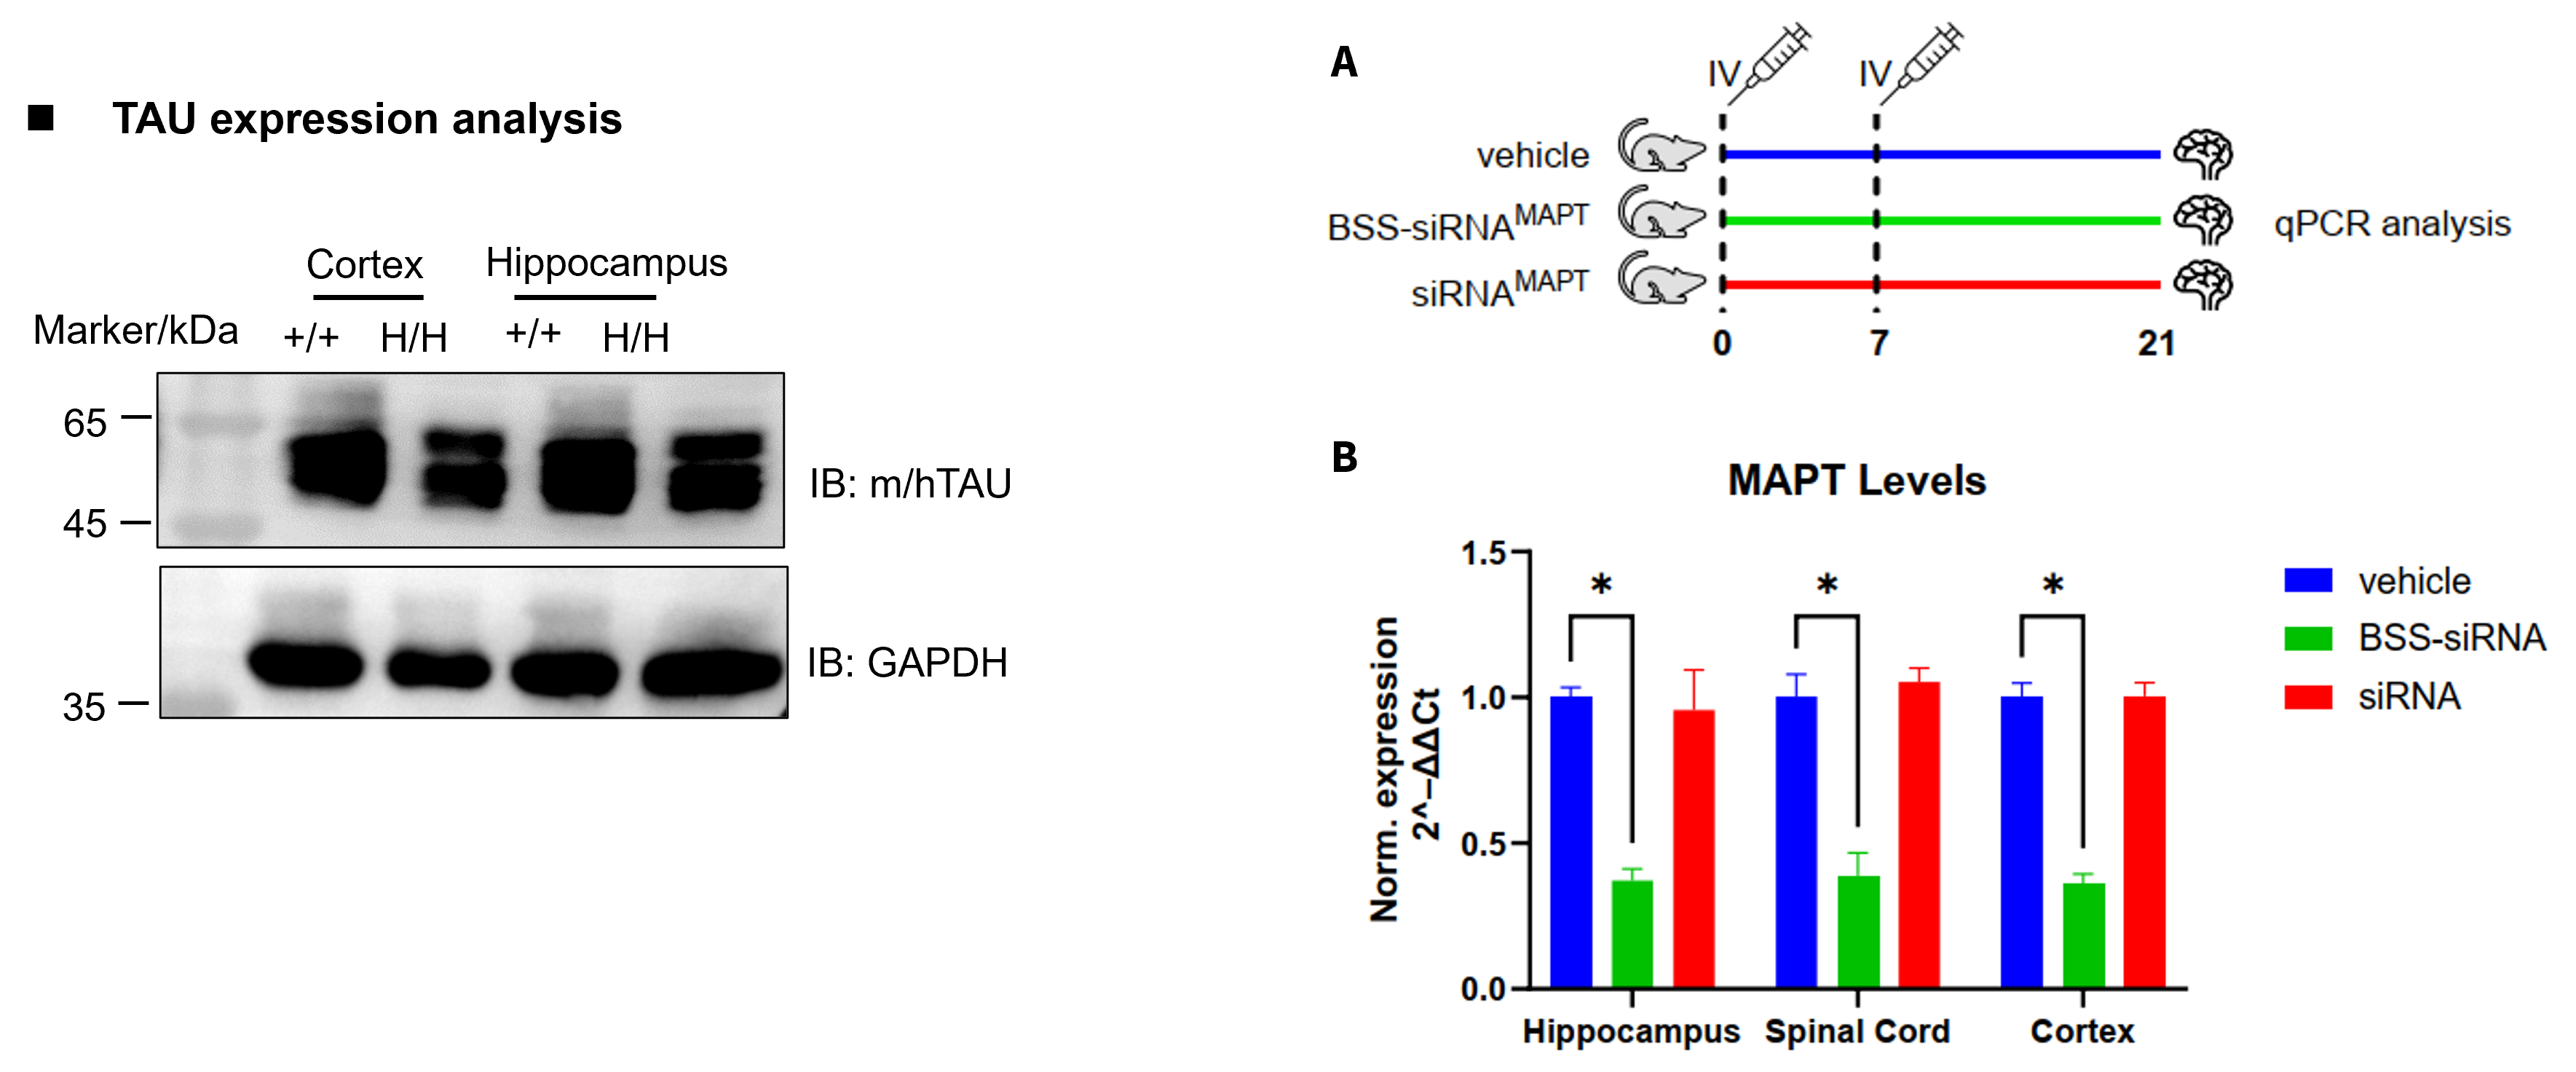
The inhibitory efficiency of the antibody oligonucleotide conjugate (AOC) drug against human MAPT in TFR1/TAU humanized mice.
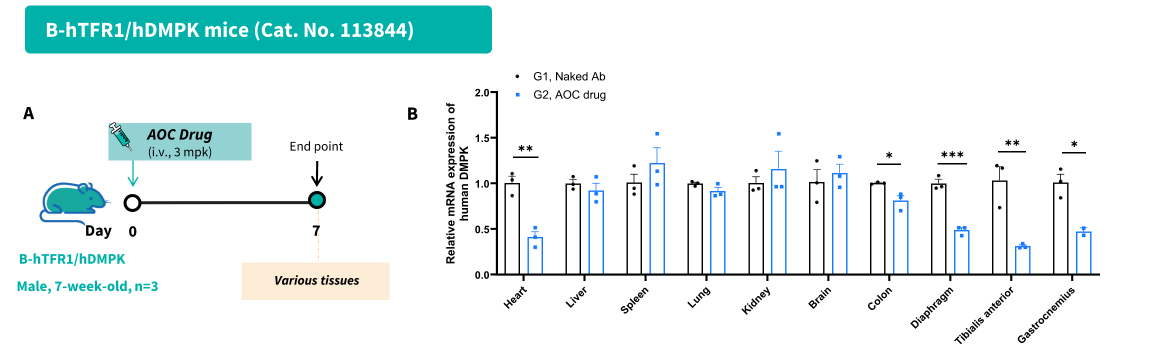
The inhibitory efficiency of the antibody oligonucleotide conjugates (AOC) drug against human DMPK in homozygous TFR1/DMPK humanized mice. The antibody oligonucleotide conjugates drug (AOC, produced in house), naked antibody (produced in house) were administered individually on day 0 to the homozygous TFR1/DMPK humanized mice (male, 7-week old, n=3). The mice were sacrificed on day 7, and various tissues were collected to detect the expression level of human DMPK mRNA by qPCR. Values are expressed as mean ± SEM.
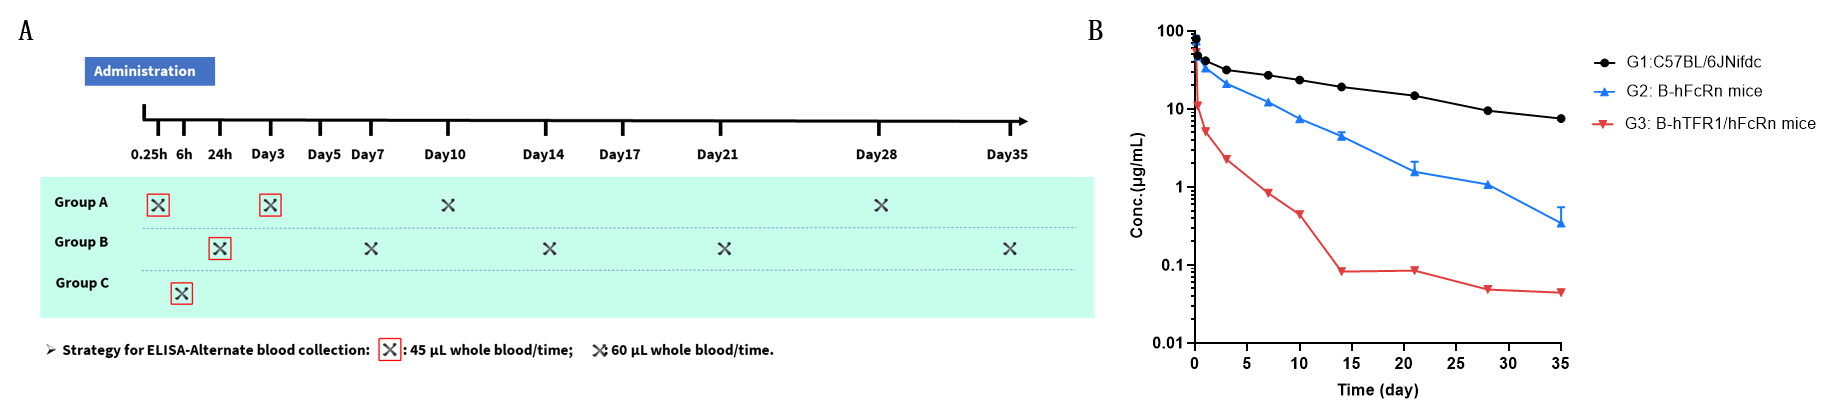
Pharmacokinetic (PK) analysis of JR-141 analog in wild-type and humanized TFR1/FcRn mouse strains. (A) Scheme design. Male mice (n = 9 per group) from wild-type C57BL/6 mice (G1), B-hFcRn mice (G2) and B-hTFR1/hFcRn mice (G3) received a single intravenous (i.v.) dose of 3 mg/kg JR-141 analog. Blood samples were collected at 0.25 h, 6 h, 24 h, and on days 3, 7, 10, 14, 21, 28, and 35 post-administration. (B) Serum concentrations of JR-141 analog were measured by ELISA. Compared to wild-type mice (G1), B-hFcRn mice (G2) and B-hTFR1/hFcRn mice (G3) exhibited accelerated clearance. TFR1/FcRn humanized mice better reflect in vivo antibody concentration changes compared to wild-type C57BL/6JNifdc and B-hFcRn mice, especially valuable for evaluating the PK of antibodies exhibiting target-mediated drug disposition (TMDD) in a more physiologically relevant context.
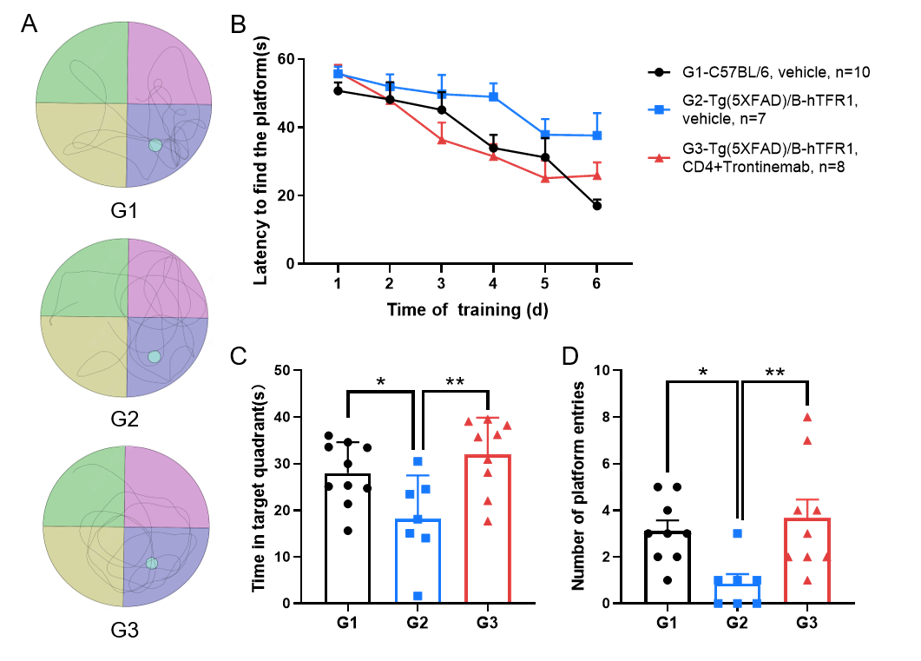
This experiment was conducted in collaboration with the client using Tg(5XFAD)/B-hTFR1 mice.
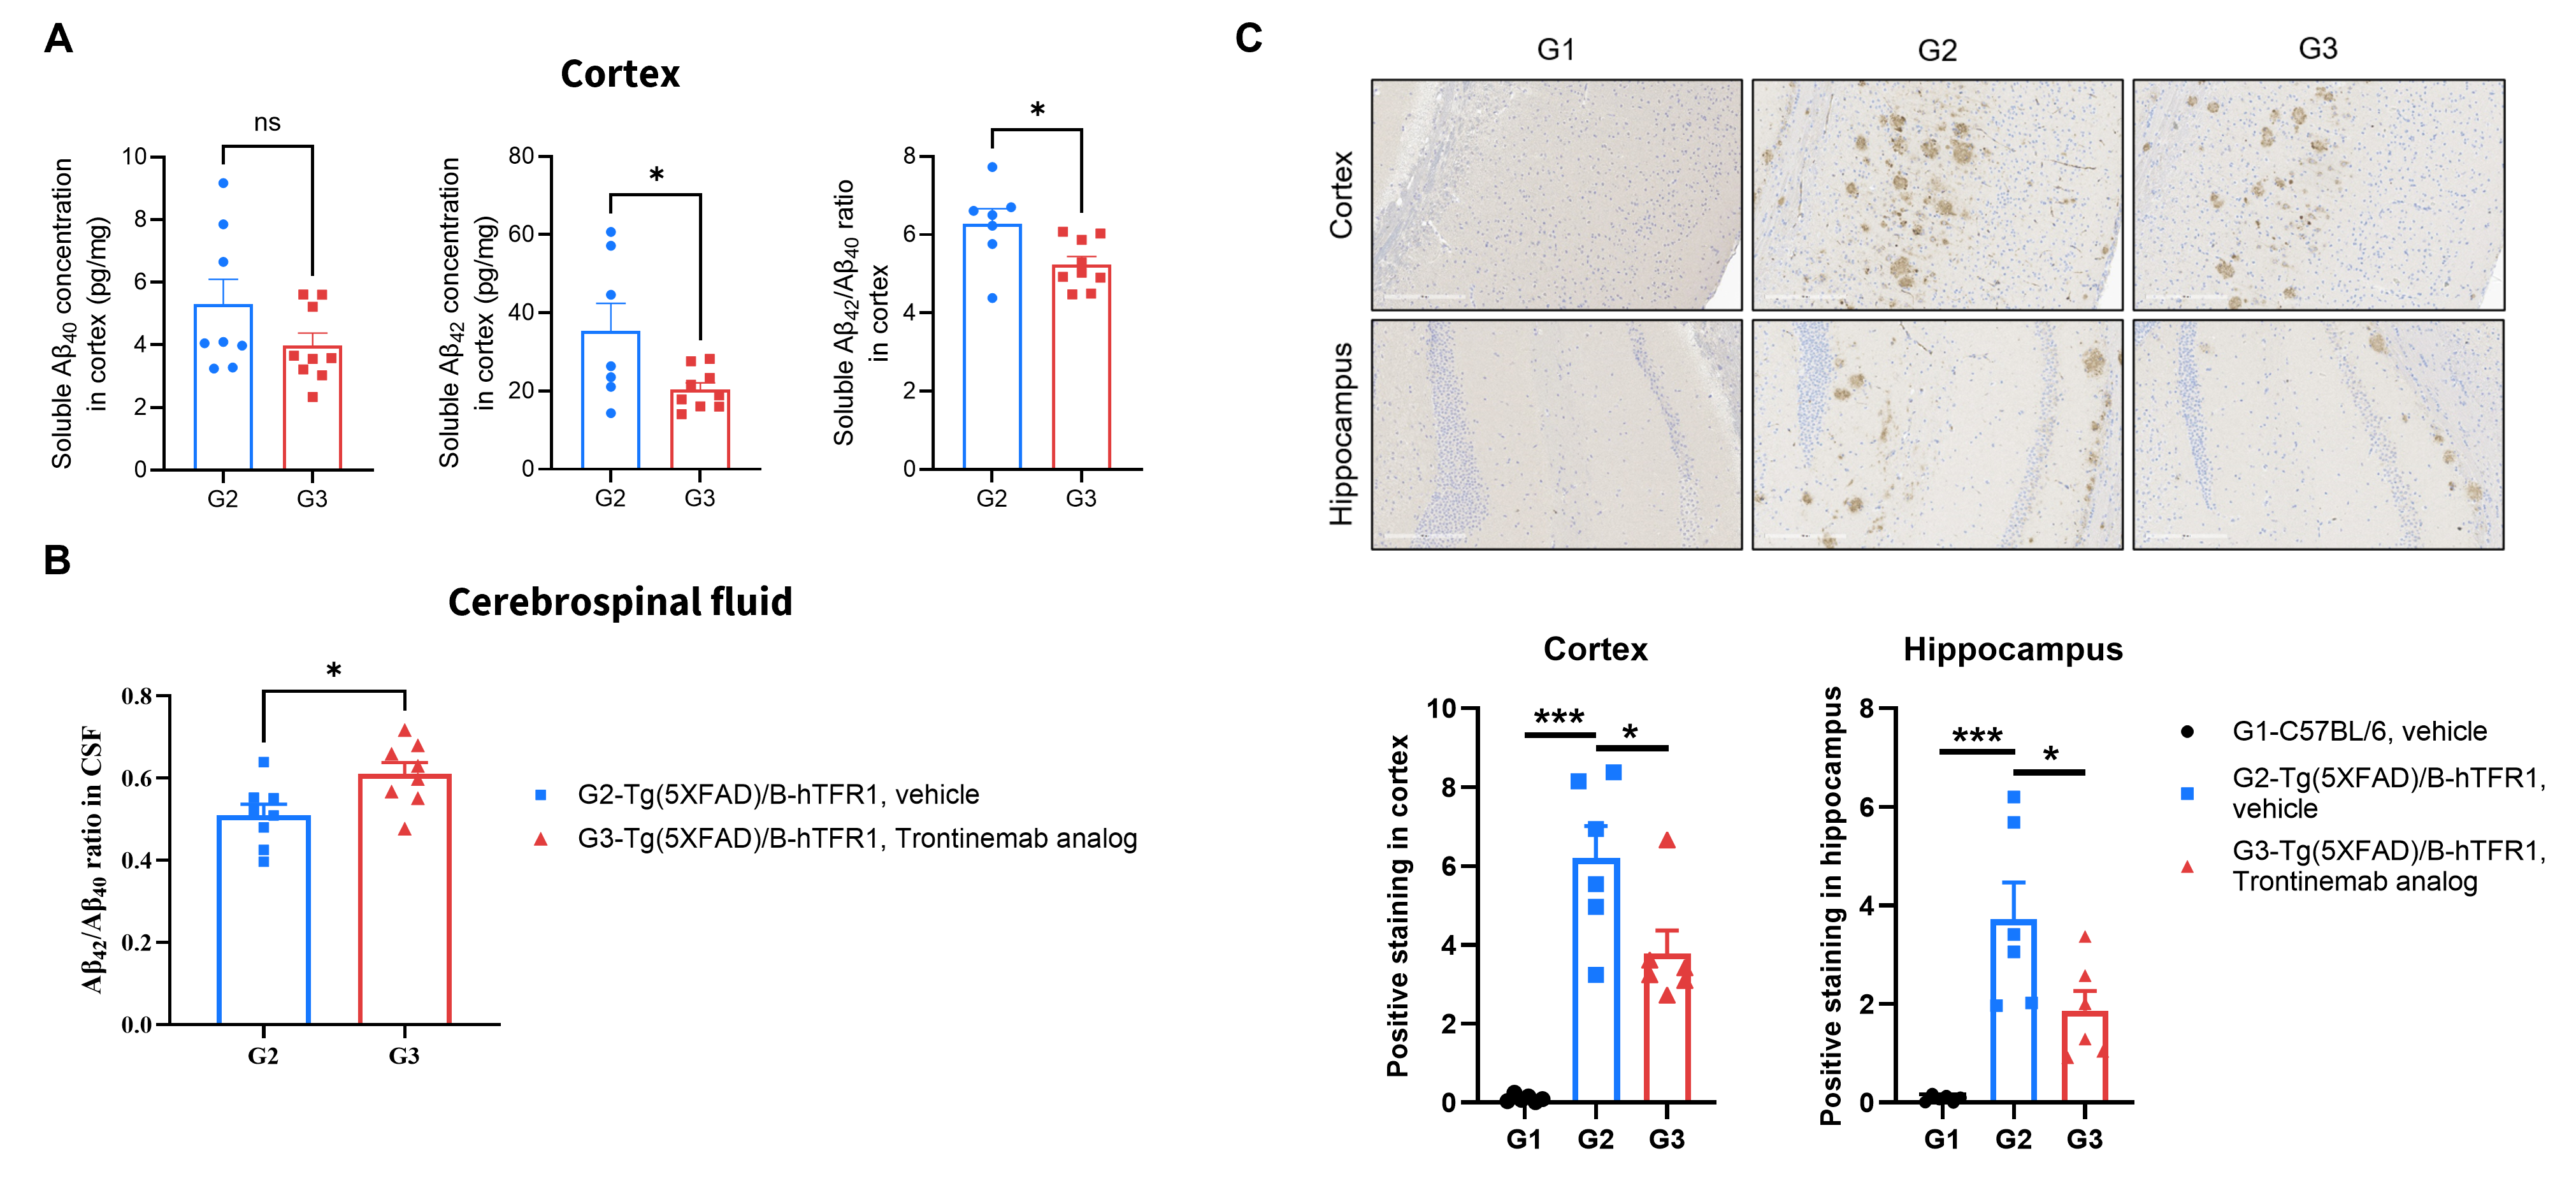
This experiment was conducted in collaboration with the client using Tg(5XFAD)/B-hTFR1 mice.